Summer Certification Limited Time 70% Discount Offer - Ends in 0d 00h 00m 00s - Coupon code = getmirror
Pass the Tableau Certified Consultant TCC-C01 Questions and answers with ExamsMirror
Exam TCC-C01 Premium Access
View all detail and faqs for the TCC-C01 exam
853 Students Passed
91% Average Score
93% Same Questions
A client has a pipeline dashboard that takes a long time to load. The dashboard is connected to only one large data source that is an extract.
It contains two calculated fields:
. TOTAL([Opportunities])
· SUM([Value])
It also contains two filters:
. A Relative Date filter on Created Date, a Date field containing values from 5 years ago until today
. A Multiple Values (Dropdown) filter on Account Name, a String field containing 1,000 distinct values
A consultant creates a Performance Recording to troubleshoot the issue, and finds out that the longest-running event is "Executing Query."
Which step should the consultant take to resolve this issue?
A client has several long-term shipping contracts with different vendors that set rates based on shipping volume and speed. The client requests a dashboard
that allows them to model shipping costs for the next week based on the selected shipping vendor. Speed for the end user is critical.
Which dashboard building strategy will deliver the desired result?
A company has a sales team that is segmented by territory. The team's manager wants to make sure each sales representative can see only data relevant to
that representative's territory in the team Sales Dashboard.
The team is large and has high turnover, and the manager wants the mechanism for restricting data access to be as automated as possible. However, the
team does not have a Tableau Data Management license.
What should the consultant recommend to meet the company's requirements?
A client wants guidance for Creators to build efficient extracts from large data sources.
What are three Tableau best practices that the Creators should use? Choose three.
A client requests a published Tableau data source that is connected to SQL Server. The client needs to leverage the multiple tables option to create an
extract. The extract will include partial data from the SQL Server data source.
Which action will reduce the amount of data in the extract?
A client has a published dashboard. They change the dashboard and then republish it. Now, usersreport that their web browser bookmarks to the dashboard
are broken.
What are two possible causes for this issue? Choose two.
From the desktop, open the CC workbook.
Open the City Pareto worksheet.
You need to complete the Pareto chart toshow the percentage of sales compared tothe percentage of cities. The chart mustshow references lines to visualize how thedata compares to the Pareto principle.
From the File menu in Tableau Desktop, clickSave.
From the desktop, open the CC workbook.
Open the Incremental worksheet.
You need to add a line to the chart that
shows the cumulative percentage of sales
contributed by each product to the
incremental sales.
From the File menu in Tableau Desktop, click
Save.
From the desktop, open the NYC
Property Transactions workbook.
You need to record the performance of
the Property Transactions dashboard in
the NYC Property Transactions.twbx
workbook. Ensure that you start the
recording as soon as you open the
workbook. Open the Property
Transactions dashboard, reset the filters
on the dashboard to show all values, and
stop the recording. Save the recording in
C:\CC\Data\.
Create a new worksheet in the
performance recording. In the worksheet,
create a bar chart to show the elapsed
time of each command name by
worksheet, to show how each sheet in
the Property Transactions dashboard
contributes to the overall load time.
From the File menu in Tableau Desktop,
click Save. Save the performance
recording in C:\CC\Data\.
From the desktop, open the CCworkbook. Use the US PopulationEstimates data source.
You need to shape the data in USPopulation Estimates by using TableauDesktop. The data must be formatted asshown in the following table.
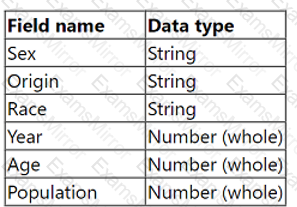
Open the Population worksheet. Enterthe total number of records contained inthe data set into the Total Recordsparameter.
From the File menu in Tableau Desktop,click Save.
TOP CODES
Top selling exam codes in the certification world, popular, in demand and updated to help you pass on the first try.