Summer Certification Limited Time 70% Discount Offer - Ends in 0d 00h 00m 00s - Coupon code = getmirror
Pass the Qlik Sense Business Analyst QSBA2021 Questions and answers with ExamsMirror
Exam QSBA2021 Premium Access
View all detail and faqs for the QSBA2021 exam
814 Students Passed
92% Average Score
95% Same Questions
Country
USA
US
U.S.A.
Refer to the exhibit.
A business analyst needs to load several data files and notices that some of the values for the United States of America are formatted inconsistently.
What should the business analyst do?
A marketing team is using an app to analyze the company events. The team registers attendees with information such as an ID name and region and discusses business opportunities with attendees Opportunities are evaluated m time and set to a different status.
The team wants to use insight Advisor to query events and opportunities to:
• Review specific areas and periods
• Use marketing terms not currently present in the app when classifying opportunities
• Define calendar periods and add calculations for specific data fields
Some examples are as follows:
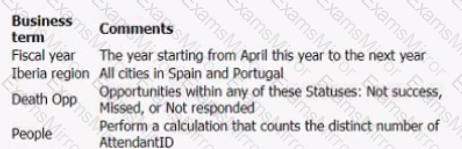
Which process should the business analyst follow?
A finance manager uses an Excel file to record travel expenses The file has historical data and is used m multiple Qlik Sense apps The finance manager needs to deploy only the past three months of data to the regional sales managers
Which solution should be used to meet the requirements using the data manager?
A business analyst inherits an app full of sheets The business analyst needs to redesign the app using the DAR principle How should the business analyst orderthe visualizations?
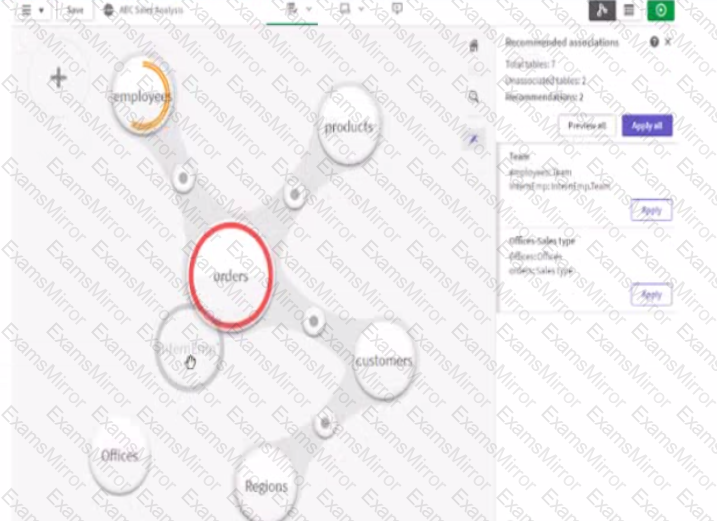
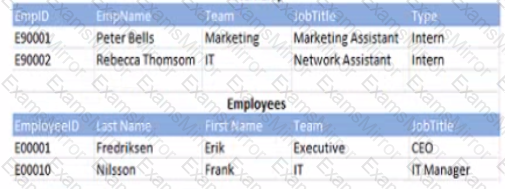
Refer to the exhibit.
A business analyst must add a list of interns to the current sates app. The app contains an existing employees table When the business analyst profiles the data the association vow displays possible associations as shown.
Which action should the business analyst take to meet the requirements?
A business analyst is creating an app that requires several visualizations
• A scatter plot mat shows the margin percentage and total sales by product category
• A map with a the layer that visualizes lines between retail stores and lactones
• A KPI that shows total cost
Margin% can be calculated by dividing profit by revenue Profit is the difference between total cost and total sates
Which two sets of fields can the business analyst use to meet these requirements? (Select two.)
To improve efficiencies a hospital mustanalyze how often a surgery is started late by operating room and surgeon The business analyst must consider several factors
• Dates of each surgery
• Number of minutes the start of the surgery is delayed
• Operating room
• Surgeon name
Which visualization should the business analyst use to meet these requirements?
A business analyst is developing an app that contains a data model with fields Country. City. Sales ProductName and ProductCategory.The global sales manager wants to add new visualizations to this app
The business analyst must include the following
• Ability to dynamically change the number of countries and cities
• Display a maximum of 10 countries
• Display a maximum of 5 cities per country
Which steps should the business analyst take?
Refer to the exhibit.
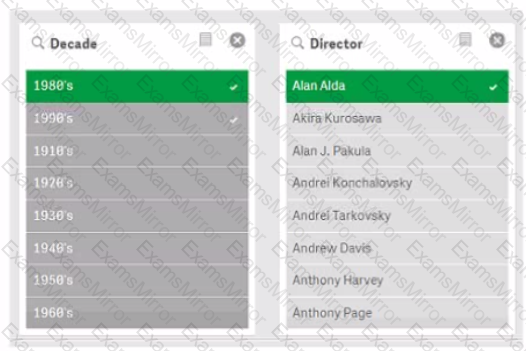
What is the selection slate of light gray values?
A company CEO requests a dashboard that easily displays provides understating and tracks company performance. There are several ma n dashboard requirements:
• Viewable by a mobile device
• Display multiple key measures
• Provide ability to easily navigate to other sheets
Which feature meets these requirements?
TOP CODES
Top selling exam codes in the certification world, popular, in demand and updated to help you pass on the first try.