Summer Certification Limited Time 70% Discount Offer - Ends in 0d 00h 00m 00s - Coupon code = getmirror
Pass the Qlik Sense Business Analyst QSBA2022 Questions and answers with ExamsMirror
Exam QSBA2022 Premium Access
View all detail and faqs for the QSBA2022 exam
775 Students Passed
90% Average Score
93% Same Questions
A business analyst is creating an app for the sales team. The app must meet several requirements:
• Compare 10 top-performing sales representatives and the amount of sales for each
• Investigate margin percentage and total sales by each product category
• View distribution of sales amount
Which visualizations should be used for this app?
A business analyst is creating an app for the team. A set of selections must be applied every time an app is opened. Which action should the business analyst take to meet this requirement?
A customer needs to demonstrate the value of sales for each month of the year with a rolling 3-month summary. Which visualization should the business analyst recommend to meet the customer's needs?
A business analyst from the APAC region is creating a single KPI object for that region.
The analyst must meet the following requirements:
• The KPI should show a total of sales
• The business wants to compare current year (CY) vs last year (LY) sales
• The KPI should not change if the user makes selections
Which measure(s) will allow the KPI object to fulfill this requirement?
A)

B)

C)

D)

An app needs to load a few hundred rows of data from a .csv text file. The file is the result of a concatenated data dump by multiple divisions across several countries. These divisions use different internal systems and processes, which causes country names to appear differently. For example, the United States of America appears in several places as 'USA', 'U.S.A.', or 'US'.
For the country dimension to work properly in the app, the naming of countries must be standardized in the data model.
Which action should the business analyst complete to address this issue?
Refer to the exhibit.
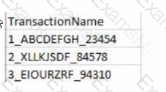
The users of a Qlik Sense app report slow performance. The app contains approximately 10 million rows of data. The business analyst notices the following KPI master measure definition:
Left{ Trim( TransactionName), 1 ) * Right ( TransactionName, 5) Which steps should the business analyst complete to improve app performance?
The sales manager is investigating the relationship between Sales and Margin to determine if this relationship is linear when choosing the dimension Customer or Product Category.
The sales manager wants to have the potential percentage Sales for each Stage (Initial to Won) of the sales process.
Which visualizations will meet these requirements?
The business analyst creates one table by concatenating and joining several source tables. This has resulted in a table of several thousand rows that may have several columns containing between 30% and 70% null values. The business analyst needs to understand the level of null values in each field of this table to determine if this is an issue.
Which capability should the business analyst use?
A business analyst using a shared folder mapped to S:\488957004\ receives an Excel file with more than 100 columns. Many of the columns are duplicates. Any current columns that should be used have the suffix '_c' appended to the column name.
Which action should the business analyst take to load the Excel data?
Refer to the exhibit.
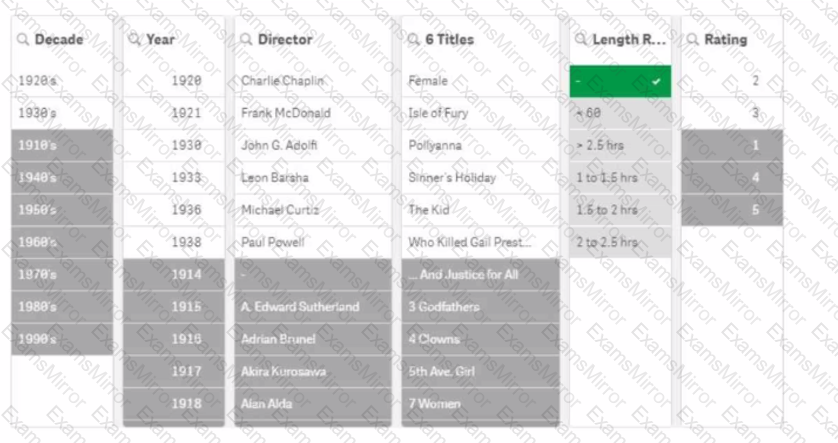
A movie analyst is using an app to gain insights into films created in the early 20th century. The analyst reviews the filter for Length Range, notices a hyphen "-", and selects it.
What can the analyst determine from the resulting filter panes?
TOP CODES
Top selling exam codes in the certification world, popular, in demand and updated to help you pass on the first try.