Summer Certification Limited Time 70% Discount Offer - Ends in 0d 00h 00m 00s - Coupon code = getmirror
Pass the Qlik Sense Business Analyst QSBA2024 Questions and answers with ExamsMirror
Exam QSBA2024 Premium Access
View all detail and faqs for the QSBA2024 exam
753 Students Passed
94% Average Score
97% Same Questions
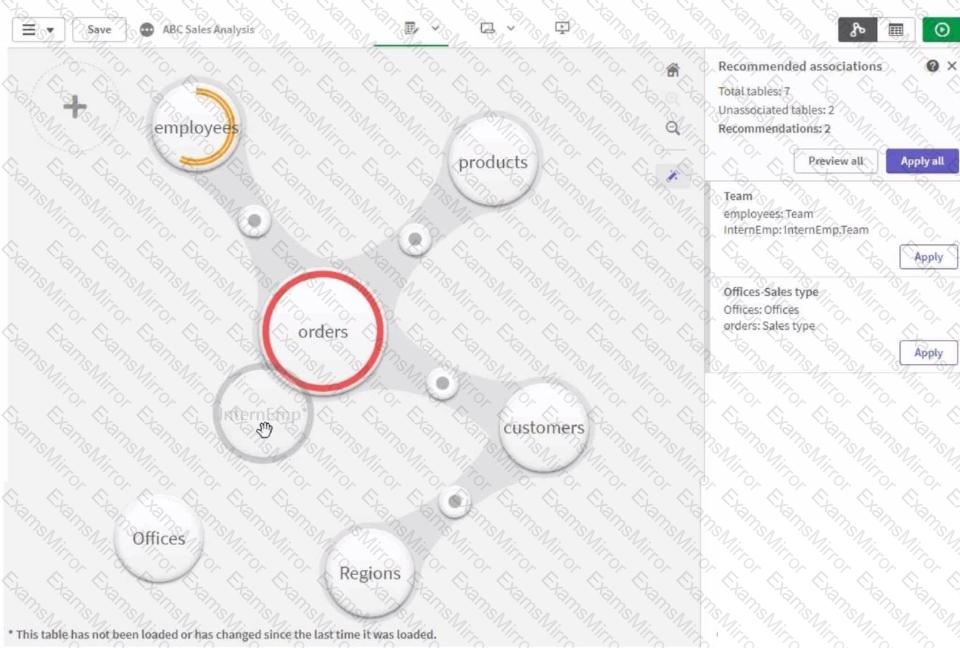
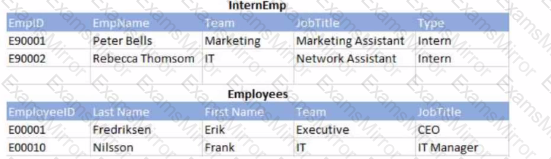
Refer to the exhibits.
A business analyst must add a list of temporary employees (interns) to the current sales app. The app contains an existing employees table. When the business analyst profiles the data, the association view displays possible associations as shown.
Which action should the business analyst take in Data manager to meet the requirements?
A business analyst is creating an app for the sales team. The app must meet several requirements:
• Compare 10 top-performing sales representatives and the amount of sales for each
• Investigate margin percentage and total sales by each product category
• View distribution of sales amount
Which visualizations should be used for this app?
A business analyst is working with retail data for consumer products. The customer is interested in the following:
• Ability to look for outliers on sales volume and margin %
• Ability to understand the clustering of products visually
• Ability to see products that are above the median sales volume
Which action should the business analyst take to implement these requirements?
A business analyst needs to create two side-by-side charts for a sales department with the following data:
• Number of orders
• Name of the customer
• Percentage of margin
• Total sales
The charts use a common dimension, but each chart has different measures. The analyst needs to create a color association between the two charts on the dimension values.
Which action should the business analyst take?
A business analyst is building an app to analyze virus outbreaks. They create a bar chart using a dimension of Continent, and a measure of Sum (Knowningsections). They require a secondary bar on the chart, so they create a second measure using Count (MajorCities).
The bar chart adjusts, but no bars are visible for this second measure. Which action should the business analyst take to resolve this issue?
Refer to the exhibit.
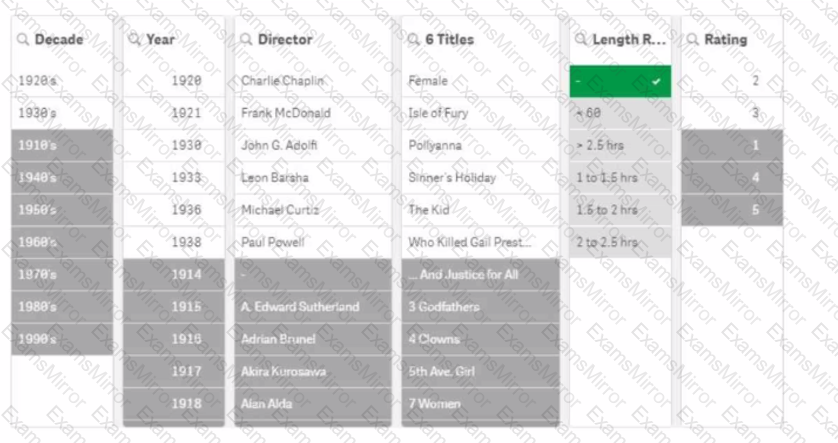
A movie analyst is using an app to gain insights into films created in the early 20th century. The analyst reviews the filter for Length Range, notices a hyphen "-", and selects it.
What can the analyst determine from the resulting filter panes?
An app needs to load a few hundred rows of data from a .csv text file. The file is the result of a concatenated data dump by multiple divisions across several countries. These divisions use different internal systems and processes, which causes country names to appear differently. For example, the United States of America appears in several places as 'USA', 'U.S.A.', or 'US'.
For the country dimension to work properly in the app, the naming of countries must be standardized in the data model.
Which action should the business analyst complete to address this issue?
A business analyst needs to create a visualization that compares two measures over time using a continuous scale that includes a range. The measures will be Profit and Revenue.
Which visualization should the business analyst use?
The CEO has requested a dashboard that tracks the company's performance. The main requirements for the dashboard:
• Minimal number of visualizations or objects
• Display multiple key measures
• Ability to easily navigate to other sheets
Which features would meet the requirements?
A business analyst designs a visualization to analyze a count of products by fixed price ranges. The customer now wants the price ranges to be dynamically modified so they are configurable by the application users. The business analyst modified the dimension axis on the visualization.
Which step should the business analyst complete next?
TOP CODES
Top selling exam codes in the certification world, popular, in demand and updated to help you pass on the first try.