Weekend Special Limited Time 70% Discount Offer - Ends in 0d 00h 00m 00s - Coupon code = simple70

Pass the QlikView Business Analyst QV12BA Questions and answers with ExamsMirror

Practice at least 50% of the questions to maximize your chances of passing.
Exam QV12BA Premium Access

View all detail and faqs for the QV12BA exam


444 Students Passed

92% Average Score

93% Same Questions
Viewing page 1 out of 2 pages
Viewing questions 1-10 out of questions
Questions # 1:

Refer to the exhibits.

Question # 1

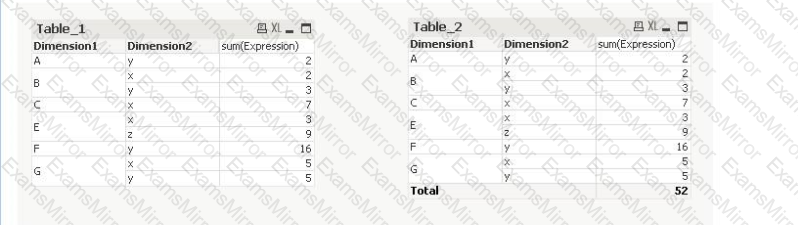
Table_1 has been transformed into Table_2. Which action did the business analyst take to transform the table?

Options:

A.

In the Dimension Limits tab, checked Show Total

B.

In the Presentation tab. checked Subtotals at Top

C.

In the Presentation tab. checked Show Partial Sums

D.

In the Presentation tab checked Totals on Last Row

Questions # 2:

Refer to the exhibits

Question # 2

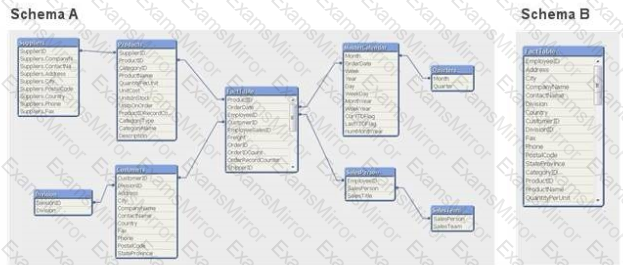
Schema A displayed in the exhibit has been transformed into Schema B

How can the before and after schemas be described?

Options:

A.

The star schema has been transformed into a normalized schema.

B.

The star schema has been transformed into a de-normalized schema

C.

The snowflake schema has been transformed into a normalized schema

D.

The snowflake schema has been transformed into a de-normalized schema

Questions # 3:

Which three options can be used to change the background on a bar chart? (Select three )

Options:

A.

Color

B.

Image

C.

Multicolored

D.

Dynamic Image

E.

Persistent Colors

Questions # 4:

Refer to the exhibit.

Question # 4

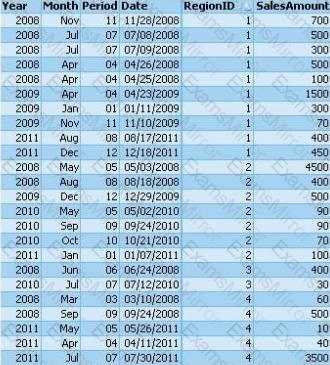
The Sales table shown represents the entire data set A business analyst adds an expression in a document:

Question # 4

Next, the analyst selects Year = '2010' and RegionID = '2\. What is the result of the expression with these selections?

Options:

A.

250

B.

750

C.

850

D.

650

Questions # 5:

A business analyst has data for these fields

• Year

• Sales Amount

• Product Number

• Country

• Order Number

Which three KPIs may be calculated? (Select three.)

Options:

A.

Average Sales Per Year

B.

Total Sales by Country

C.

Total Sales by Customer

D.

Average Order Sales Amount

E.

Total Customer Count by Country

Questions # 6:

A customer needs to see sales data by month, with a rolling six month average of margin percent for any selected twelve month period. Which chart will meet these requirements?

Options:

A.

A combo chart of sales as bars and rolling six month average margin percent as a line by Month Year

B.

A pie chart of sales by Month Year and a line chart of rolling six month average margin percent by MonthYear

C.

A bar chart of sales by month by year and a straight table of rolling six month average margin percent by MonthYear

D.

A trellis chart of bar charts as sales by month by year and a pivot table of rolling six month average margin percent by month by year

Questions # 7:

A business analyst needs to open another GlikView document by trigger Which two options can be used to perform this task? (Select two.)

Options:

A.

Text box trigger

B.

Field event trigger

C.

Line object trigger

D.

Activate sheet trigger

E.

Variable event trigger

Questions # 8:

A data architect needs to develop a dashboard to represent the previous year's sales performance in a simple KPI object Which expression should be used to calculate this value?

Options:

A.

Sum({}Sales)

B.

Sum({}Sales)

C.

Sum(Aggr(Sum(Sales),Max(Year)-1))

D.

Sum(Aggr

Questions # 9:

A data model contains 1 billion records and a straight table renders all of the data at the most granular level. The business users do NOT need all of the detailed information. The business analyst needs to improve the rendering time of the straight table.

Which two approaches should the analyst use? (Select two )

Options:

A.

Update the straight table to a more summarized view

B.

Replace all table fields with only one field which concatenates the values of all previous table fields

C.

Remove all master dimensions and master measures, and replace with distinct expressions in each visualization

D.

Specify a specific sort order in the output of the straight table using a field not found in the straight table columns

E.

Set up a calculation condition to only show the straight table if filtered down to a much smaller number of rows (e.g., 100k rows)

Questions # 10:

A business analyst needs to sort the values for the Product dimension explicitly as "Planes", then "Trains", then "Automobiles" The analyst needs a highly optimized solution to provide the best performance for an application with between 900 million and 1 billion records

Which solution should the analyst use?

Options:

A.

Use the Ord function in the user interface to sort in a custom order

B.

Build nested IF statements in the user interface to assign numeric values, then sort numerically

C.

Create a new calculated dimension in the Ul named ProductSort, then sort the Product field by the new ProductSort field

D.

Assign a numeric value to the Product values using the DUAL function during the data load, then sort numerically in the Ul

Viewing page 1 out of 2 pages
Viewing questions 1-10 out of questions
TOP CODES

TOP CODES

Top selling exam codes in the certification world, popular, in demand and updated to help you pass on the first try.