
Halloween Sale Special Limited Time 75% Discount Offer - Ends in 0d 00h 00m 00s - Coupon code = drift75
Pass the Salesforce Tableau Data Analyst Analytics-DA-201 Questions and answers with ExamsMirror
Exam Analytics-DA-201 Premium Access
View all detail and faqs for the Analytics-DA-201 exam
740 Students Passed
93% Average Score
97% Same Questions
When a Data Analyst needs to format workbook settings, which options are available in the Format Workbook panel?
A Data Analyst is using containers on a dashboard.
How should the analyst make sure multiple objects within a container are always taking up the same width or height, even if the container is resized?
A Data Analyst needs to develop a Sales Dashboard that users can access through a computer or by phone and tablet using the same URL link.
How should the analyst create dashboards that are formatted for specific devices?

You need the top 10 values to appear in a different color. The lop 10 values must be colored dynamically.
What should you do?
You have a Tableau workbook that has a live data source. The data source connects to a Microsoft SQL Server database. Only the users in your department can access the database.
You plan to publish the workbook to a Tableau Server site named Public. All the users in your company can access Public.
What are two ways to ensure that all the users can view the worksheets in the workbook? Choose two.
You have a dashboard that is configured for desktop browsers.
You want to customize a layout for mobile users.
Which option should you select first? (Click the appropriate Option in the Answer Area.)


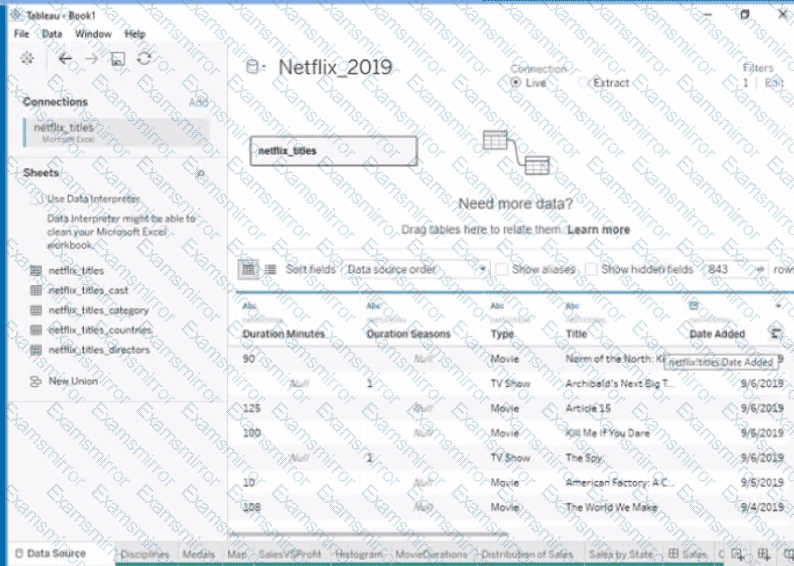
Open the link to Book1 found on the desktop. Open the Movie Durations worksheet.
Replace the existing data source with the Netflix_2019 data source.
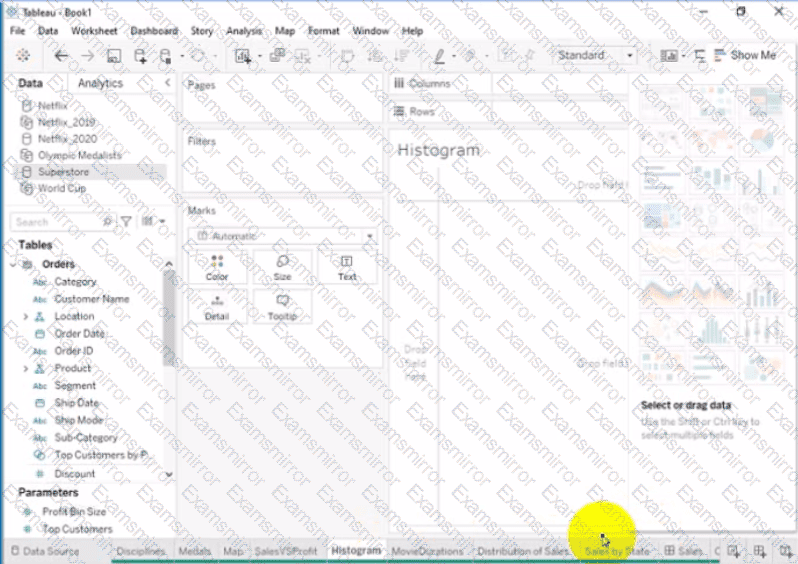
Open the link to Book1 found on the desktop. Open the Histogram worksheet and use the Superstone data source.
Create a histogram on the Quantity field by using bin size of 3.
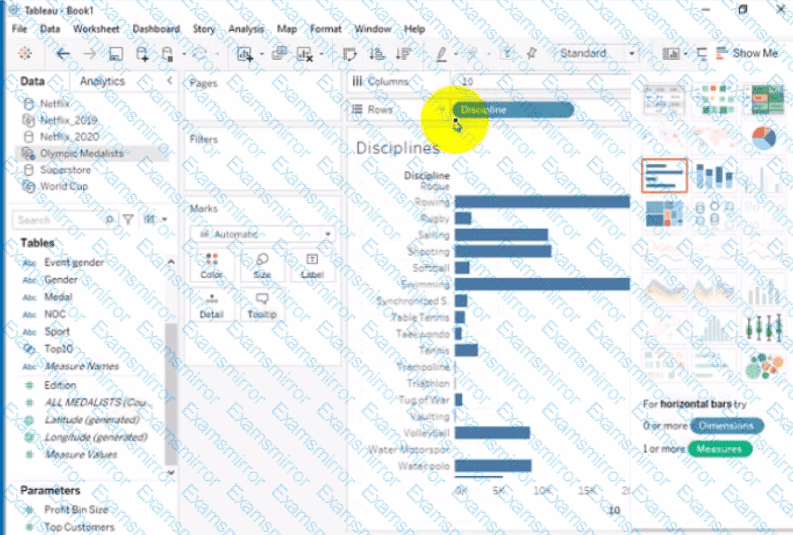
Open the link to Book1 found on the desktop. Open Disciplines worksheet.
Filter the table to show the members of the Top10 set and the members of the Bottom10 set. There should be a total of 20 rows.
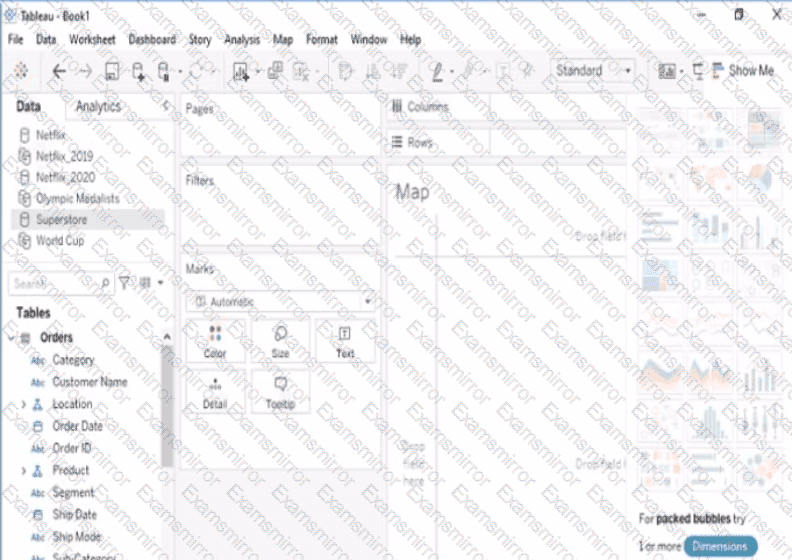
Open the Link to Book1 found on the desktop. Open Map worksheet and use Superstore data source.
Create a filed map to show the distribution of total Sales by State across the United States.

TOP CODES
Top selling exam codes in the certification world, popular, in demand and updated to help you pass on the first try.