
Weekend Sale Special Limited Time 75% Discount Offer - Ends in 0d 00h 00m 00s - Coupon code = drift75
Pass the WGU Courses and Certificates Applied-Probability-and-Statistics Questions and answers with ExamsMirror
Exam Applied-Probability-and-Statistics Premium Access
View all detail and faqs for the Applied-Probability-and-Statistics exam
0 Students Passed
0% Average Score
0% Same Questions
R² = 0.81 → correlation r = ?
A sociologist is investigating the relationship between educational level, high school, bachelor’s, master’s, and doctorate, and annual income.
How should this study be classified?
A marketing analyst is studying the relationship between customer age groups, teens, adults, and seniors, and their preferred shopping methods, online and in-store.
Which numerical measure is most appropriate for this study?
A road safety research group wants to enhance road safety by analyzing the stopping distance of a car at different speeds. The group has recorded their data in the following scatterplot.
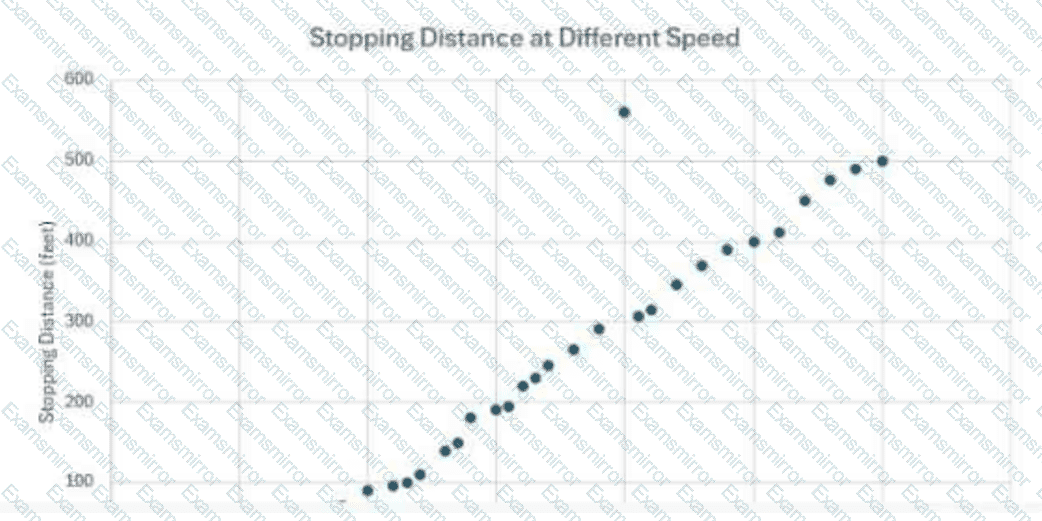
What is true about the outlier in the scatterplot?
Uniform distribution 0–10: P(X < 4) = ?
Type I error α = 0.05 means:
Rare event count per interval modeled by:
There are 10 green, 20 yellow, and 15 purple marbles in a jar.
What is the probability of selecting 2 green marbles in a row and then 1 yellow marble, replacing the marble each time?
What is the mode of this dataset: 3, 5, 7, 7, 10?
Probability of rolling an odd number on a die:

TOP CODES
Top selling exam codes in the certification world, popular, in demand and updated to help you pass on the first try.