Summer Certification Limited Time 70% Discount Offer - Ends in 0d 00h 00m 00s - Coupon code = getmirror

Pass the WGU Courses and Certificates Applied-Probability-and-Statistics Questions and answers with ExamsMirror

Practice at least 50% of the questions to maximize your chances of passing.
Exam Applied-Probability-and-Statistics Premium Access

View all detail and faqs for the Applied-Probability-and-Statistics exam


0 Students Passed

0% Average Score

0% Same Questions
Viewing page 5 out of 5 pages
Viewing questions 41-50 out of questions
Questions # 41:

Boxplot shows:

Options:

A.

Median, quartiles, outliers

B.

Frequency counts

C.

Scatterplots

D.

Probability

Questions # 42:

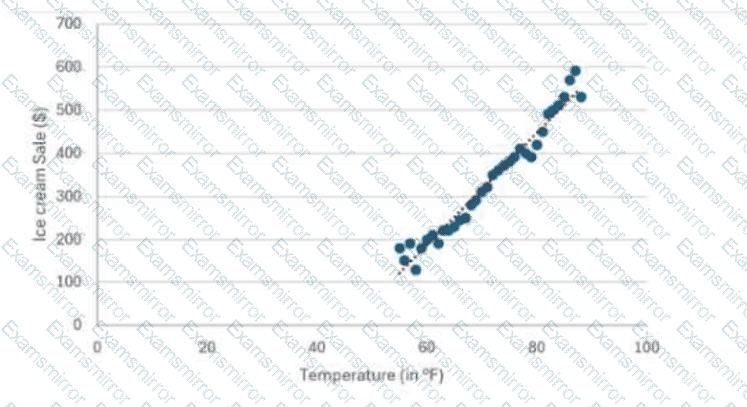
A café recorded the total ice cream sales and the average maximum temperature of the day. The scatterplot shows the recorded data. The regression equation y = 13x − 598 estimates the total ice cream sales, y, of a day and the average maximum temperature, x, on that day.
Question # 42

What does the slope represent in this context?

Options:

A.

The slope represents the total ice cream sales on a day with a temperature of 0°.

B.

The slope represents the average increase in ice cream sales for every 1° increase in temperature.

C.

The slope represents the total ice cream sales on a day with a temperature of 100°.

D.

The slope represents the average decrease in ice cream sales for every 1° increase in temperature.

Questions # 43:

Probability of exactly 1 head in 2 coin flips = ?

Options:

A.

1/2

B.

1/4

C.

3/4

D.

1

Questions # 44:

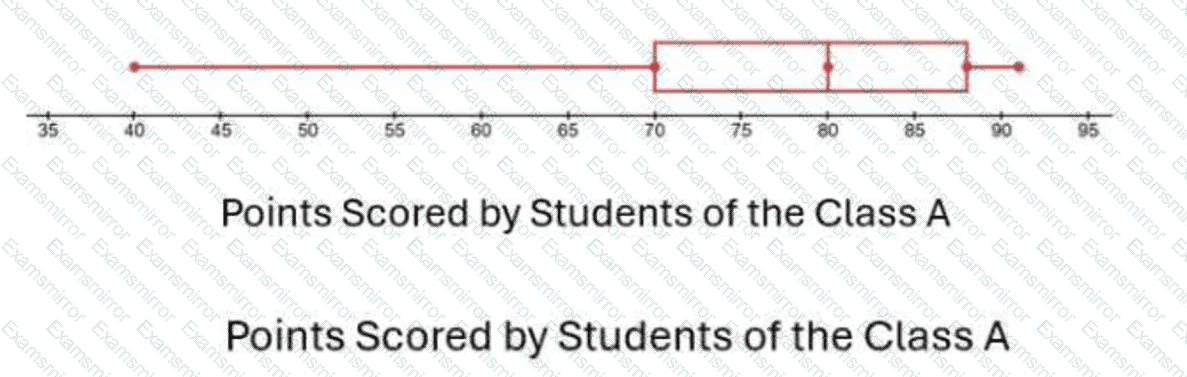
A teacher plots the test scores of a class using the box plot.
Question # 44

What is true about the test scores?

Options:

A.

The median score for Class A is 70 points.

B.

The median score for Class A is 75 points.

C.

The median score for Class A is 80 points.

D.

The median score for Class A is 88 points.

Questions # 45:

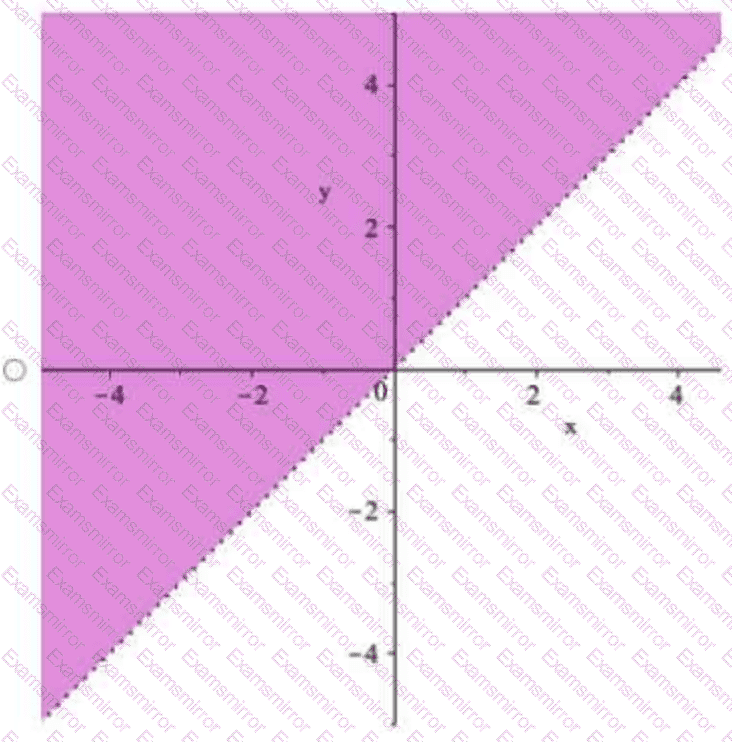
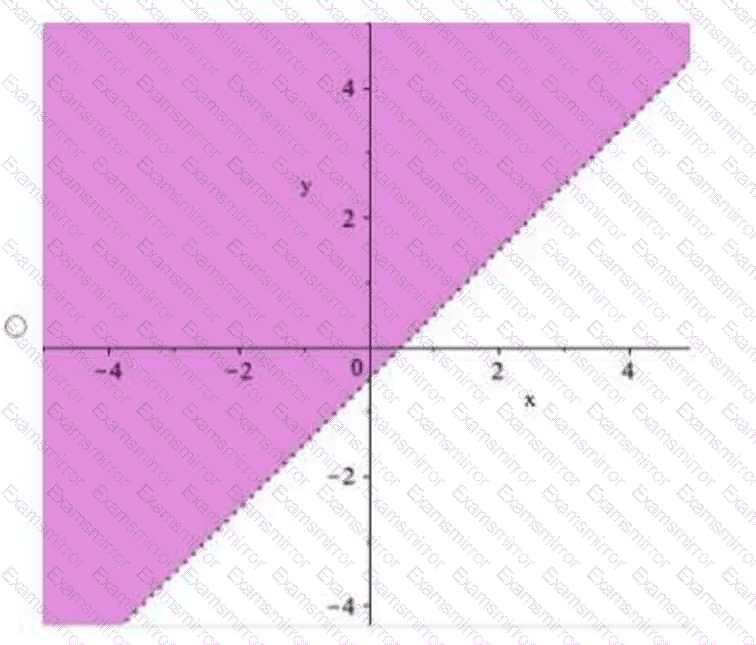
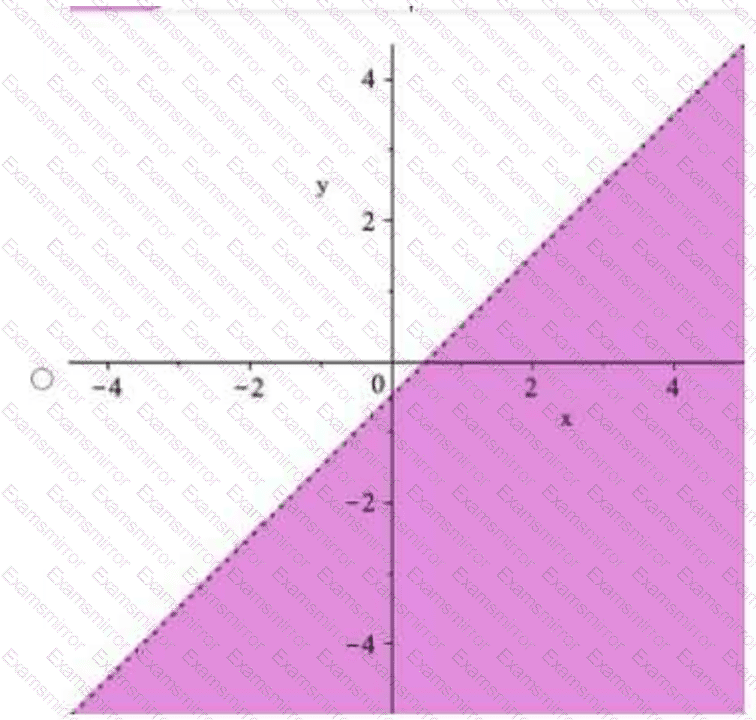
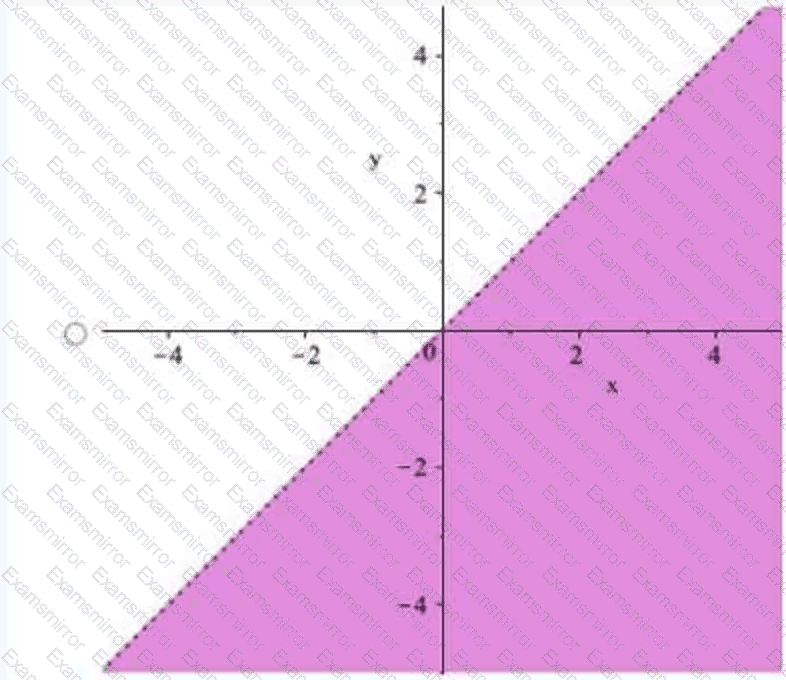
Review the following inequality:

y < x − 1/2

Which shaded portion in the graphs corresponds to this inequality?
Question # 45

Question # 45

Question # 45

Question # 45

Options:

A.

First graph

B.

Second graph

C.

Third graph

D.

Fourth graph

Questions # 46:

Probability of rolling 1, 2, or 3 on die = ?

Options:

A.

1/2

B.

1/3

C.

1/6

D.

2/3

Viewing page 5 out of 5 pages
Viewing questions 41-50 out of questions
TOP CODES

TOP CODES

Top selling exam codes in the certification world, popular, in demand and updated to help you pass on the first try.