Pre-Summer Special Limited Time 70% Discount Offer - Ends in 0d 00h 00m 00s - Coupon code = getmirror

Pass the ASQ Six Sigma Black Belt CSSBB Questions and answers with ExamsMirror

Practice at least 50% of the questions to maximize your chances of passing.
Exam CSSBB Premium Access

View all detail and faqs for the CSSBB exam


739 Students Passed

90% Average Score

93% Same Questions
Viewing page 5 out of 9 pages
Viewing questions 41-50 out of questions
Questions # 41:

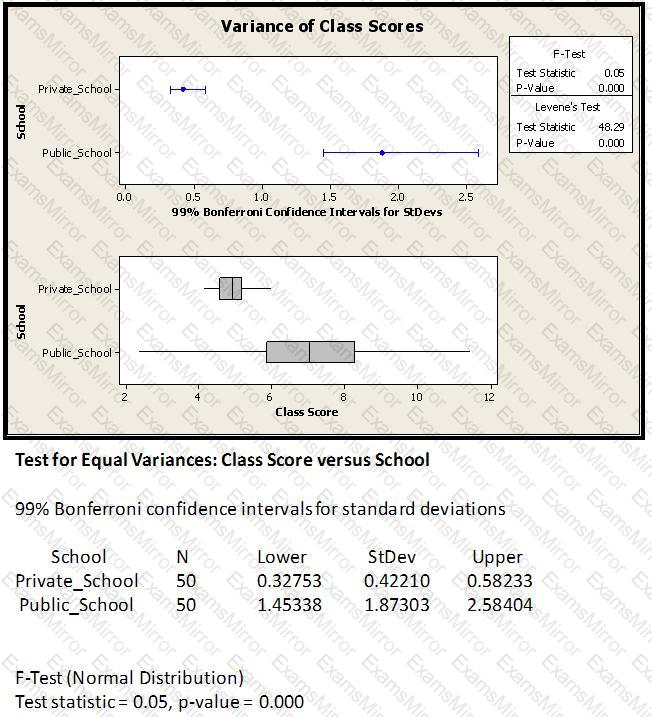
From the variance F-test shown above, which of these conclusions is/are valid?

Question # 41

Options:

A.

The variance between the class score distribution is significantly different

B.

The variance between the class score distribution is not significantly different

C.

This test applies only to Normal Distributed data at 99 % confidence

D.

This test applies only to Non-normal Data at 99 % confidence

E.

There are not enough data points to make any statistical conclusions

Questions # 42:

A(n) ______________ is best used to compare a Machine 1 average quality characteristic to the same quality characteristic of Machine 2.

Options:

A.

F test

B.

1-Sample t-test

C.

2-Sample t-test

D.

ANOVA test

Questions # 43:

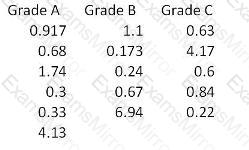
For the data set shown here which of these statements is/are true?

Question # 43

Options:

A.

Hypothesis Testing of Means or Medians cannot be done since there are an unequal number of observations for the 3 samples

B.

A Paired T-test would be applicable for comparing Grade B and Grade A since they follow each other in the data set

C.

Grade A has the lowest sample Mean of the 3 samples

D.

Grade A has a higher sample Mean than Grade B

Questions # 44:

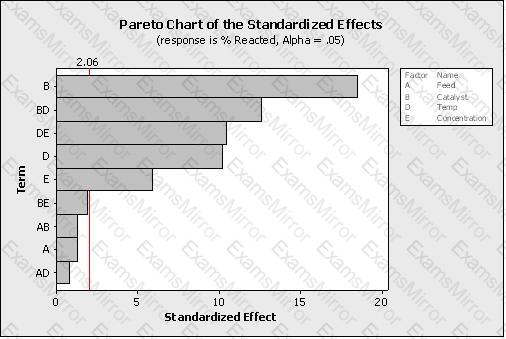
Which statement(s) are correct about the Pareto Chart shown here for the DOE analysis? (Note: There are 2 correct answers).

Question # 44

Options:

A.

It is unknown from this graph how many factors were in the Experimental Design

B.

The factors to keep in the mathematical model are E, D, DE, BD and B with an alpha risk equal to 2.06

C.

The effects to keep in the mathematical model are E, D, DE, BD and B with an alpha risk equal to 0.05

D.

The factors to keep in the mathematical model with a 5% alpha risk are BE, AB, A and AD

Questions # 45:

A valuable tool to use during the Measure Phase to show material and information flow throughout an entire process is the ______________ .

Options:

A.

Value Stream Map

B.

FMEA

C.

Pareto Chart

D.

Standard Operating Procedure

Questions # 46:

A Belt working in a supply chain environment has to make a decision to change suppliers of critical raw materials for a new product upgrade. The purchasing manager is depending on the Belt’s effort requiring that the average cost of an internal critical raw material component be less than or equal to $4,200 in order to stay within budget. Using a sample of 35 first article components, a Mean of the new product upgrade price of $4,060, and a Standard Deviation of $98 was estimated. The Alternative Hypothesis in the above example is?

Options:

A.

The Standard Deviation is equal to $300

B.

The Mean is less than $4,320

C.

The Mean is equal to $4,060

D.

The Mean is less than $4,200

E.

The Mean is greater than $ 4,200

Questions # 47:

Control Charts were developed by Dr. Shewhart to track data over time. To detect Special Cause variation the Control Charts use which of these?

Options:

A.

Data shift analysis

B.

Outlier analysis methods

C.

Center Line and Control Limits

D.

None of the above

Questions # 48:

Which Element of Waste best describes "the unnecessary movement of materials and goods"?

Options:

A.

Overprocessing

B.

Inventory

C.

Motion

D.

Conveyance

Questions # 49:

Which of these items contribute to what is necessary for successful Kaizen events?

Options:

A.

Analysis tools

B.

Management support

C.

Operator support

D.

All of these answers are correct

Questions # 50:

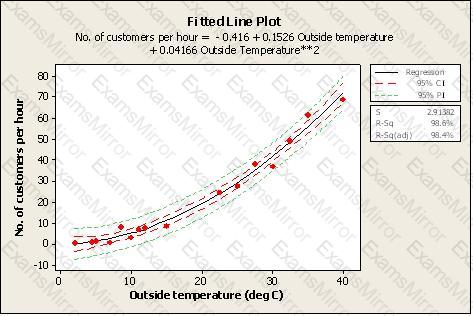
Which statement(s) are correct about the Regression shown here? (Note: There are 2 correct answers).

Question # 50

Options:

A.

The dependent variable is the outside temperature

B.

The relationship between outside temperature and number of customers per hour is a Linear Regression

C.

The dashed lines indicate with 95% confidence where all of the process data should fall between

D.

The dashed lines indicate with 95% confidence the estimate for the Quadratic Regression Line

E.

The predicted number of customers per hour is close to 5 if the outside temperature is 10 deg C

Viewing page 5 out of 9 pages
Viewing questions 41-50 out of questions
TOP CODES

TOP CODES

Top selling exam codes in the certification world, popular, in demand and updated to help you pass on the first try.