
Summer Certification Limited Time 70% Discount Offer - Ends in 0d 00h 00m 00s - Coupon code = getmirror

Pass the WGU Courses and Certificates Applied-Algebra Questions and answers with ExamsMirror

Practice at least 50% of the questions to maximize your chances of passing.
Exam Applied-Algebra Premium Access

View all detail and faqs for the Applied-Algebra exam


321 Students Passed

87% Average Score

92% Same Questions
Viewing page 3 out of 5 pages
Viewing questions 21-30 out of questions
Questions # 21:

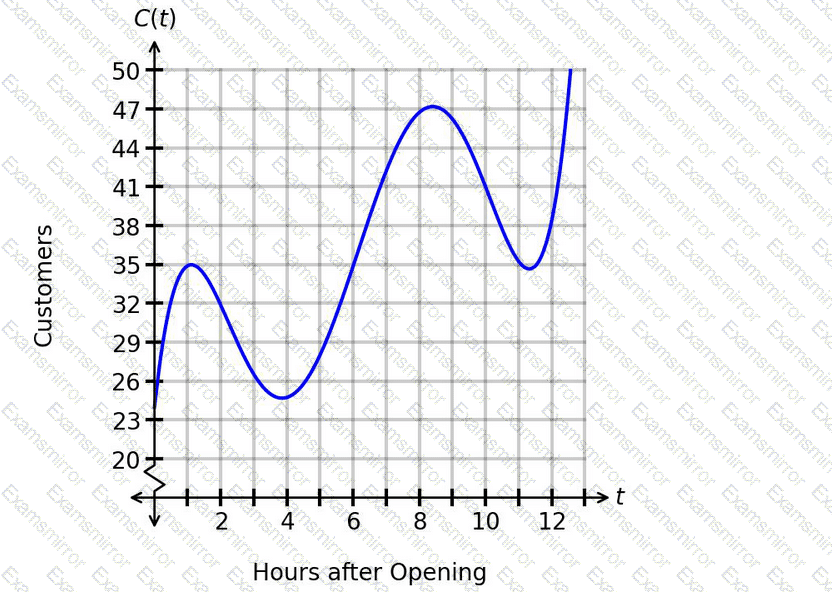
The graph shows the number of customers, C(t), showing up to a store, where the number of hours since opening is along the horizontal axis and the number of customers showing up to the store each hour is along the vertical axis.
Question # 21

How can the concavity be described from t=6.2to t=10.1?

Options:

A.

The number of customers increases faster and faster and then increases slower and slower.

B.

The number of customers decreases slower and slower and then increases faster and faster.

C.

The number of customers increases slower and slower and then increases faster and faster.

D.

The number of customers increases slower and slower and then decreases faster and faster.

Questions # 22:

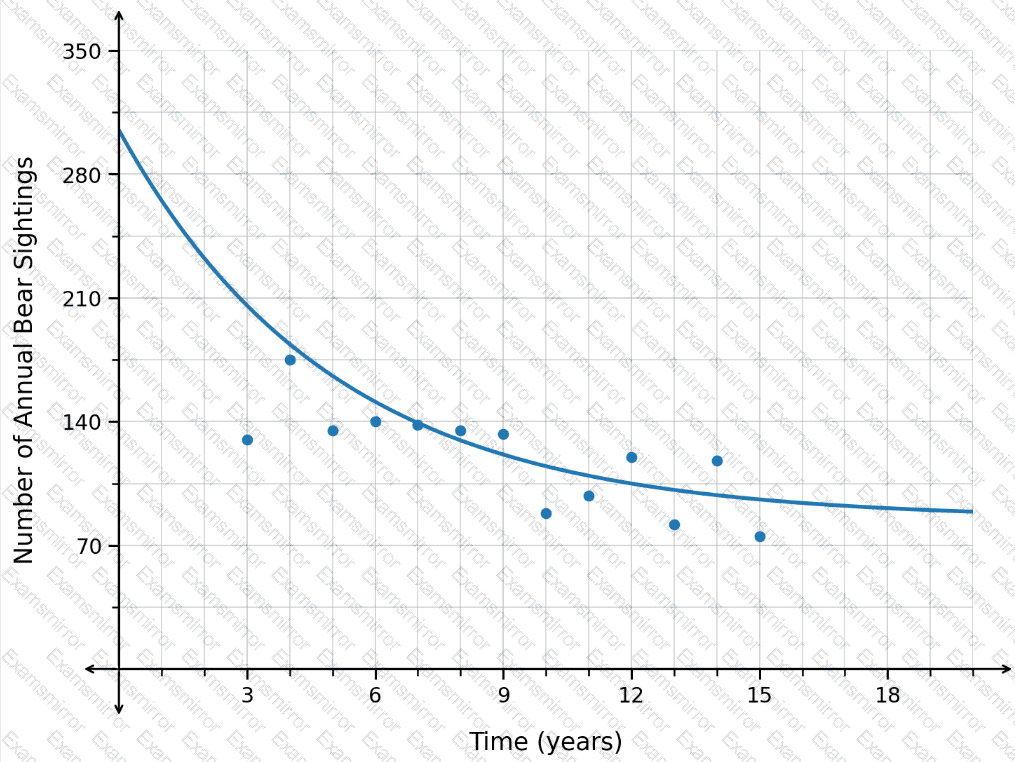
A researcher collected data on the number of annual bear sightings in a region over time. The results are shown in the scatterplot. The graphed regression function has an r

2

value of 0.41. The predicted number of annual bear sightings after 19.4 years is 88.5.
Question # 22

Is this prediction appropriate?

Options:

A.

Yes. The r

2

value indicates a strong fit, and x=19.4 is within 50% of the range of the maximum value.

B.

No. The r

2

value indicates a moderate fit, but x=19.4 is more than 25% of the range beyond the maximum value.

C.

Yes. The r

2

value indicates a moderate fit, and x=19.4 is within 25% of the range of the maximum value.

D.

No. The r

2

value indicates a strong fit, but x=19.4 is more than 50% of the range beyond the maximum value.

Questions # 23:

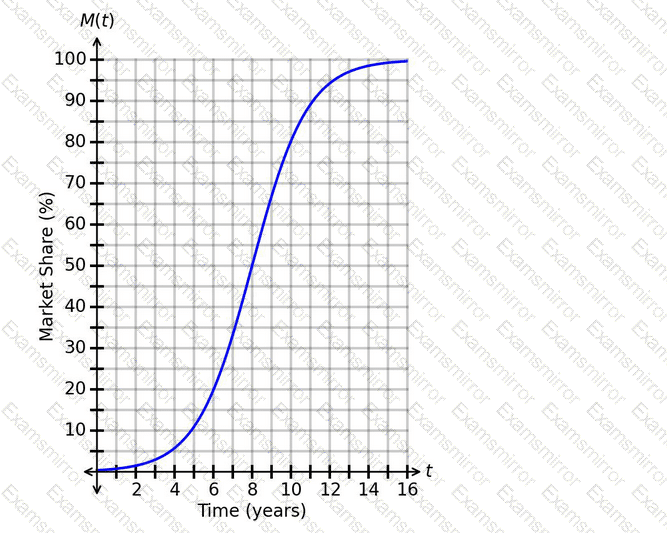
A new company just launched and is using the function M(t)to predict its market share after tyears. The graph of M(t)is shown.
Question # 23

When should the company expect to have a market share of 40%?

Options:

A.

After 0.8 years

B.

After 2 years

C.

After 7.4 years

D.

After 3 years

Questions # 24:

The given function represents the price of a commodity, p, in dollars, based on the number of months, m, since the beginning of 2020.

p(m)=5m+5

What is the average rate of change of the price over the interval m=1to m=10?

Options:

A.

5

B.

5.91

C.

32.5

D.

45

Questions # 25:

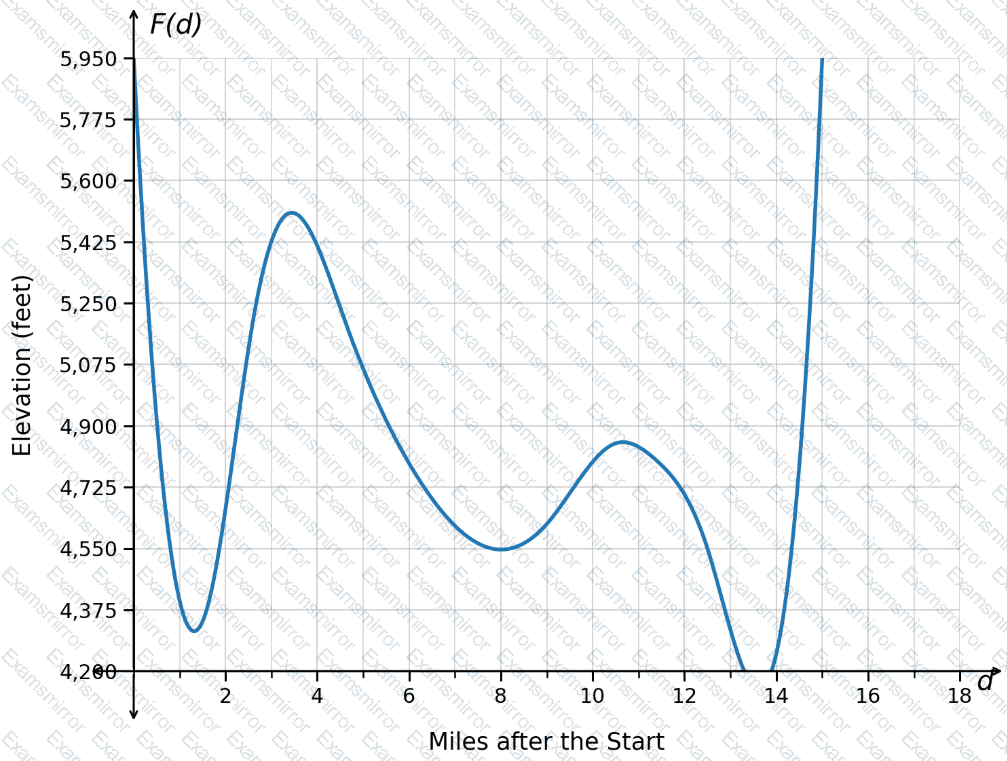
In the following graph showing the elevation profile, F(d), for a mountain biking course, the horizontal axis shows the number of miles since the start of the course and the vertical axis shows the elevation in feet.
Question # 25

How can the concavity be described from d=10 to d=13.1?

Options:

A.

The elevation increases slower and slower and then decreases faster and faster.

B.

The elevation decreases slower and slower and then increases faster and faster.

C.

The elevation decreases slower and slower and then decreases faster and faster.

D.

The elevation decreases faster and faster and then decreases slower and slower.

Questions # 26:

The function P(t)represents the daily profit, in hundreds of dollars, for a hardware store since opening. The graph of P(t)is shown.
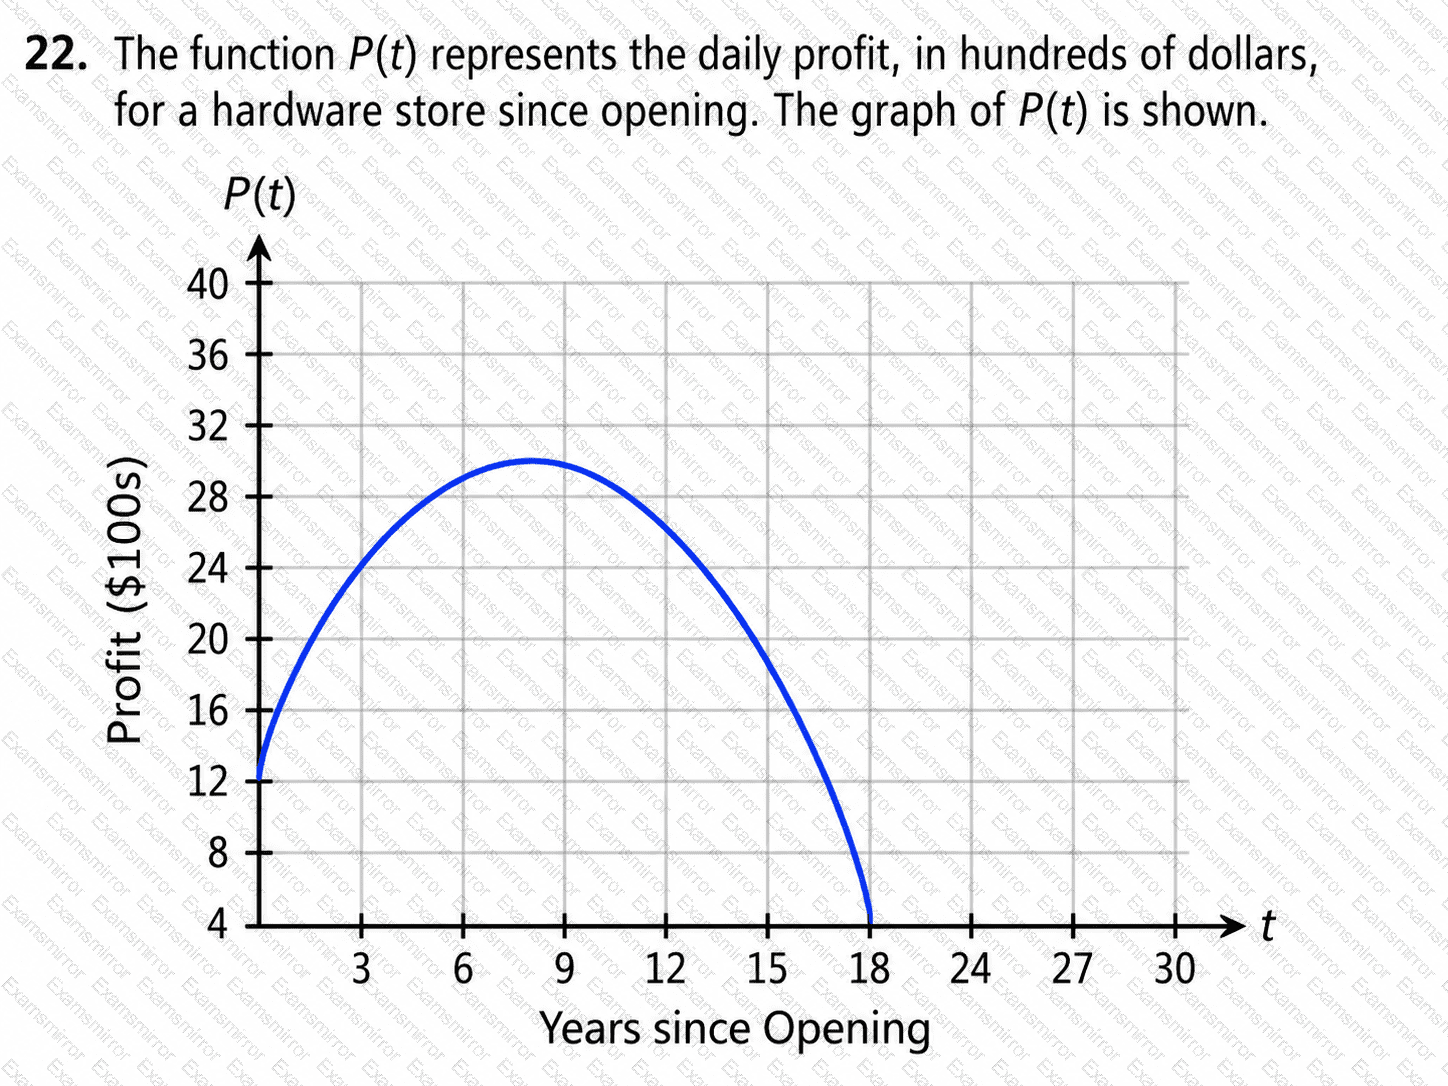
Question # 26

How should the maximum value be interpreted?

Options:

A.

Approximately 9 years after opening, a maximum daily profit of approximately $1,270was earned.

B.

Approximately 21 years after opening, a maximum daily profit of approximately $1,270was earned.

C.

Approximately 9 years after opening, a maximum daily profit of approximately $2,900was earned.

D.

Approximately 21 years after opening, a maximum daily profit of approximately $2,900was earned.

Questions # 27:

The graphed function n(t)represents the number of people, n, at a park thours after 8:00 a.m. The plotted points Aand Bhave coordinates (2│110)and (6│182).
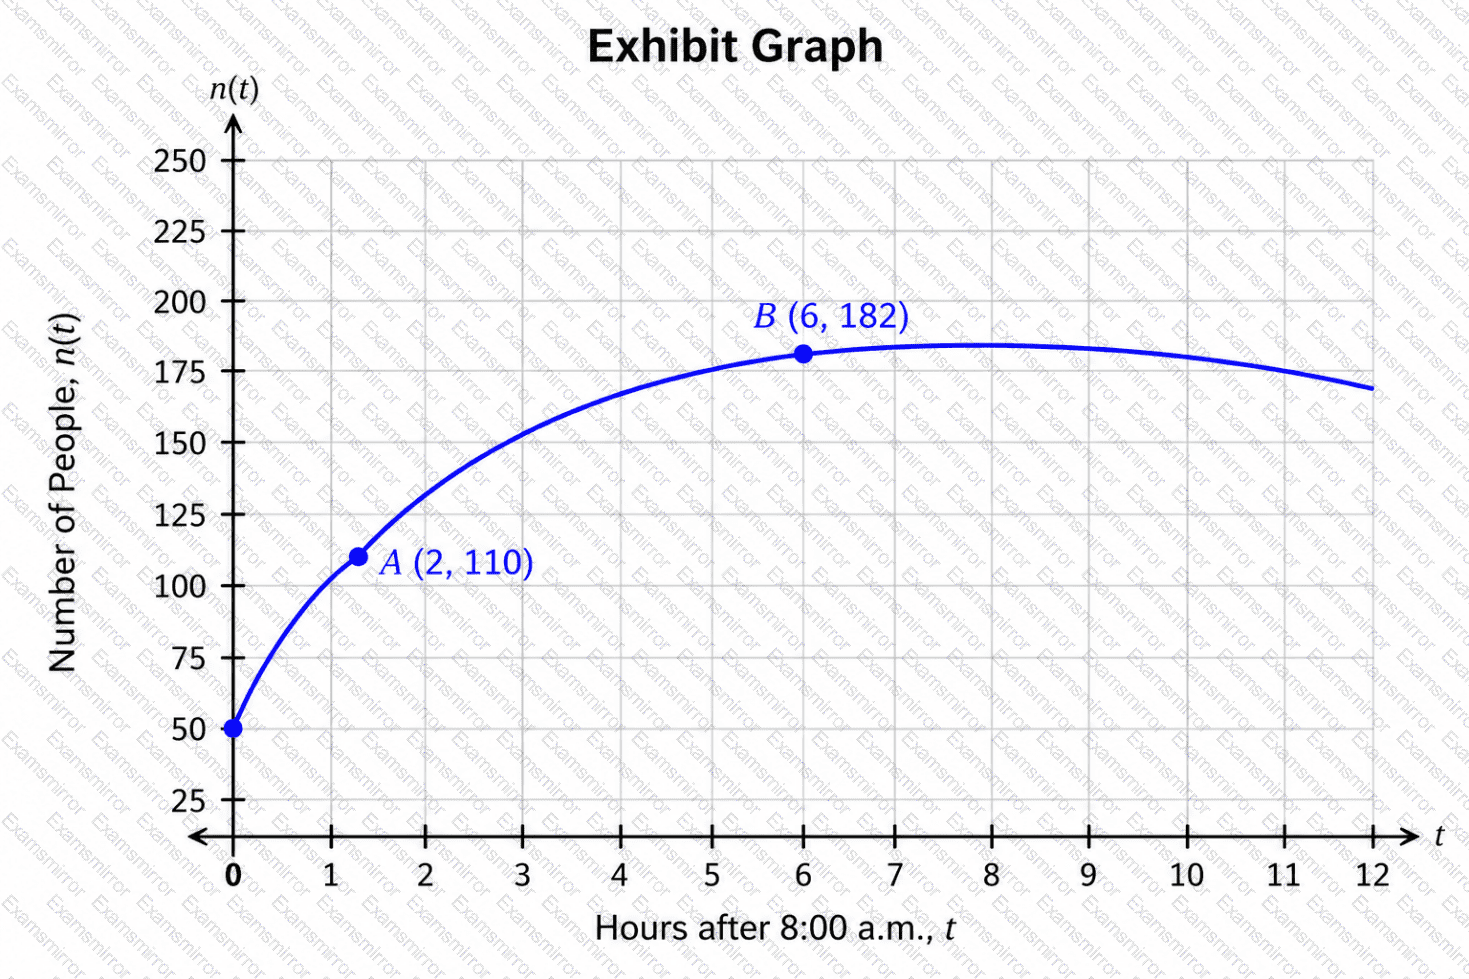
Question # 27

Which statement gives the correct interpretation of the average rate of change of the number of people over the interval from point Ato point B?

Options:

A.

The number of people at the park decreases at an average rate of 18 per hour.

B.

The number of people at the park decreases at an average rate of 9 per hour.

C.

The number of people at the park increases at an average rate of 9 per hour.

D.

The number of people at the park increases at an average rate of 18 per hour.

Questions # 28:

In the graph showing the number of new customer accounts, the horizontal axis shows the number of weeks since the beginning of winter and the vertical axis shows the number of new customer accounts. More customer accounts are opened during snowy weeks than during weeks without snow.
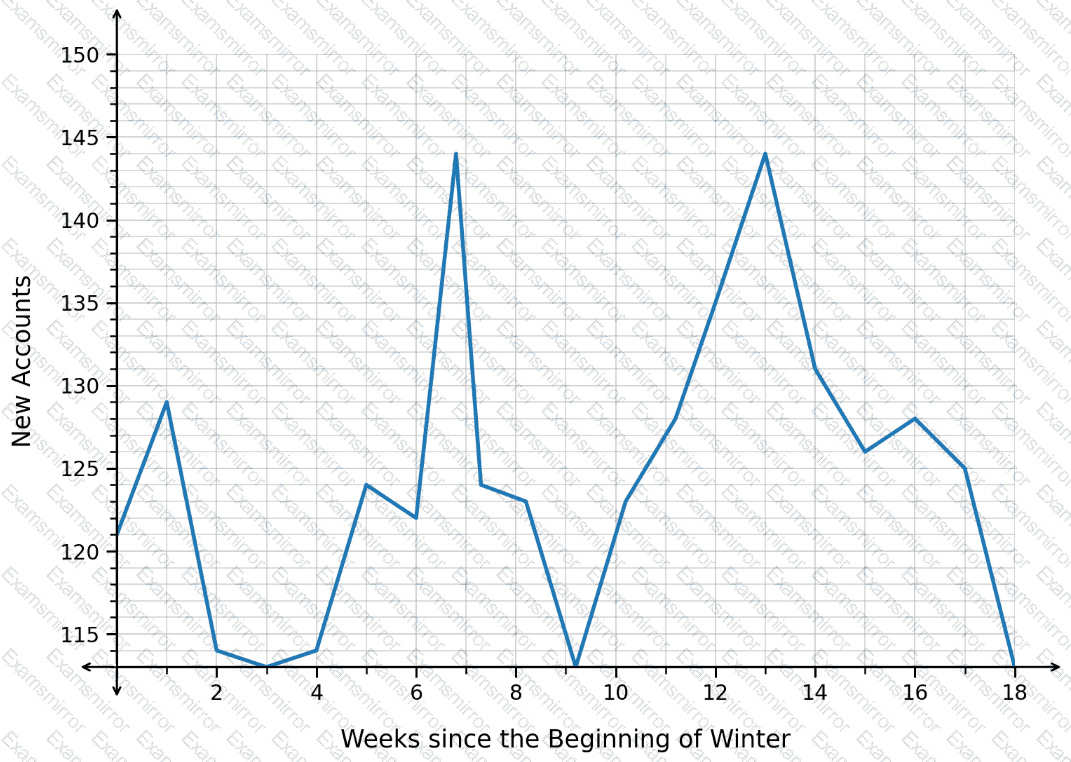
Question # 28

When was it likely snowy?

Options:

A.

It was likely snowy during only week 1.

B.

It was likely snowy during only week 7.

C.

It was likely snowy during weeks 1 and 5.

D.

It was likely snowy during weeks 7 and 14.

Questions # 29:

The population of fish in a lake is changing according to the function P(t)=31t+438, where t is the number of months since the beginning of the year and P(t) is the fish population at time t. Which interpretation of the rate of change is correct?

Options:

A.

The number of fish in the lake is increasing at a constant rate of 31 fish per month.

B.

The number of fish in the lake is increasing at a constant rate of 438 fish per month.

C.

The number of fish in the lake is decreasing at a constant rate of 31 fish per month.

D.

The number of fish in the lake is decreasing at a constant rate of 438 fish per month.

Questions # 30:

The graphed function v(t) represents the number of vehicles, v, stopped at a toll booth t hours after 6:00 a.m. The coordinates of points A and B are (1,49.4) and (4,45.8), respectively.
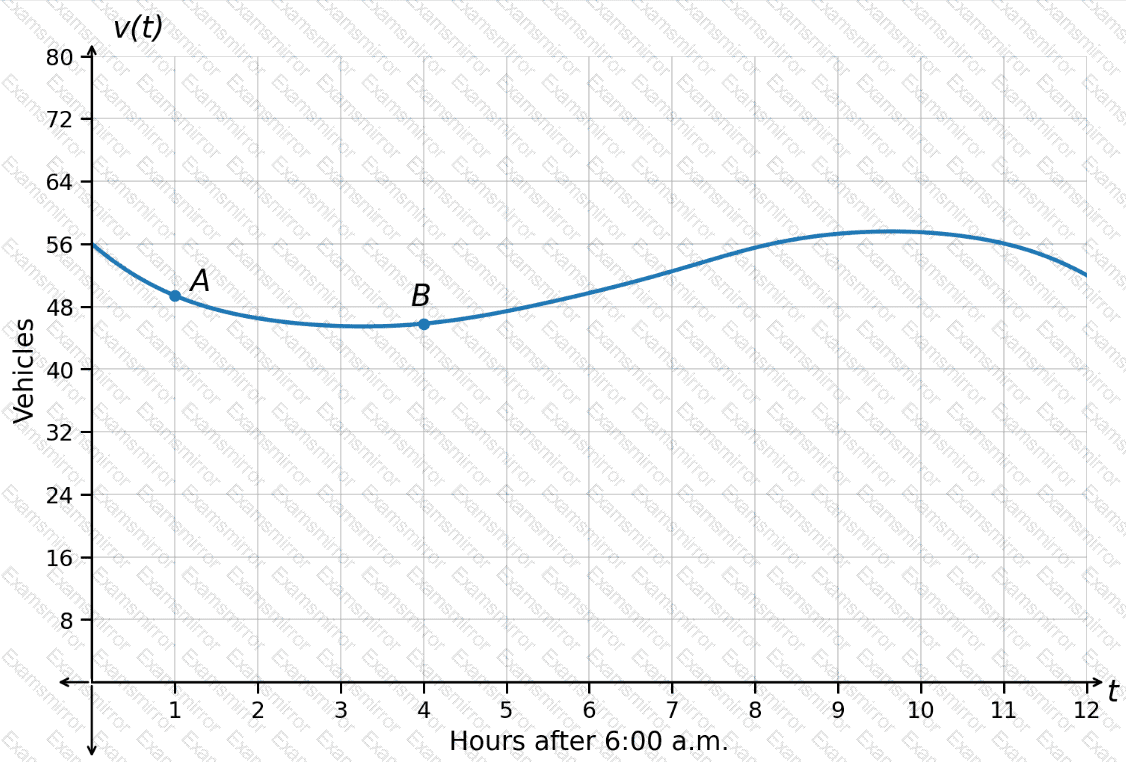
Question # 30

What is the average rate of change of the number of vehicles from point A to point B?

Options:

A.

-3.6

B.

-1.2

C.

19.04

D.

47.6

Viewing page 3 out of 5 pages
Viewing questions 21-30 out of questions
TOP CODES

TOP CODES

Top selling exam codes in the certification world, popular, in demand and updated to help you pass on the first try.