
Pre-Winter Sale Limited Time 70% Discount Offer - Ends in 0d 00h 00m 00s - Coupon code = getmirror
Pass the WGU Courses and Certificates Applied-Algebra Questions and answers with ExamsMirror
Exam Applied-Algebra Premium Access
View all detail and faqs for the Applied-Algebra exam
321 Students Passed
87% Average Score
92% Same Questions
A recipe calls for a constant ratio of water and lemon juice. The graph shows the relationship between the amounts of these two ingredients, where wis the volume of water and lis the volume of lemon juice.
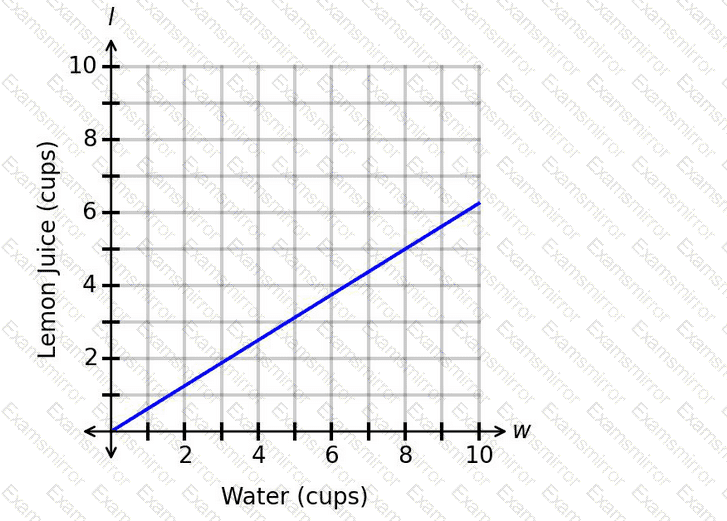
What is the correct interpretation of the rate of change?
The population of bison in a preserve can be modeled using the logistic function f(x), where x represents the number of years since the preserve was established and f(x) represents the population. The graph of f(x) is shown.
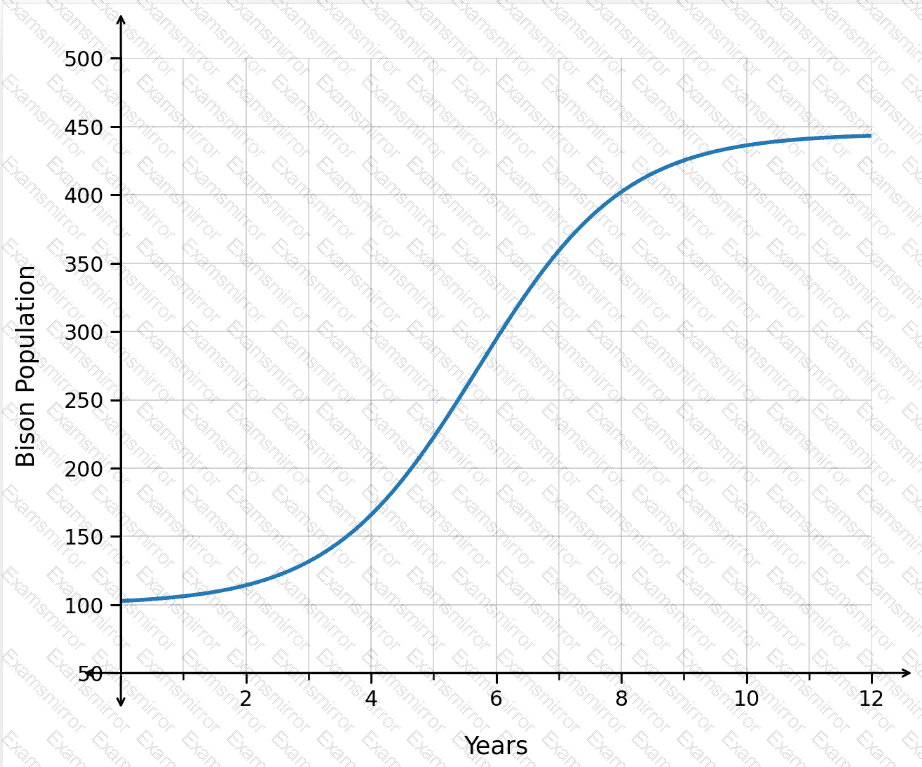
How does the bison population change as time progresses from year 7 to year 10?
A researcher collected data on the number of annual bear sightings in a region over time. The results are shown in the scatterplot. A regression function is graphed with r^2=0.42. The predicted number of annual bear sightings after 19.5years is 62.2.
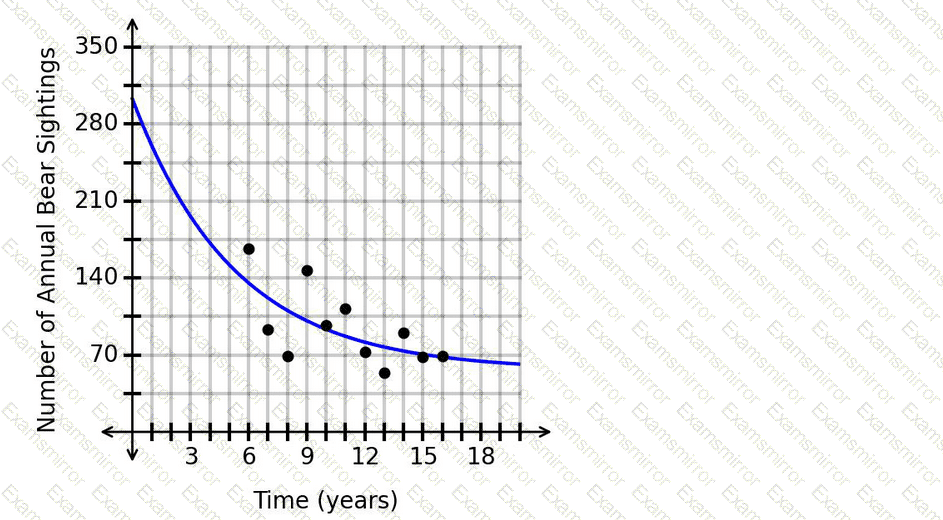
Is this prediction appropriate?
The data in the scatterplot represents the number of monthly train crossings at a particular intersection over time.
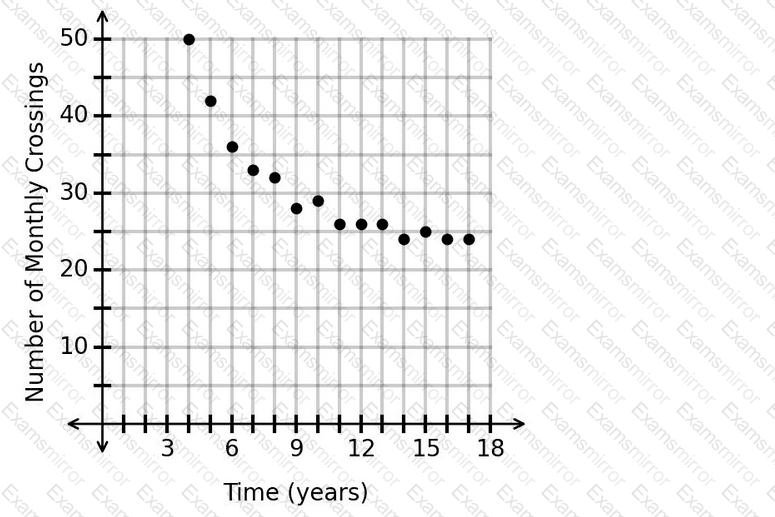
Which type of function should be used to model the data?
A set of data was gathered and used to create a model for the number of subscribers to a blog. The function model is
f(x)=190× 〖 0.99 〗 ^x
where xrepresents the number of years since 2003 and f(x)represents the number of subscribers.
What is the correct interpretation of the average rate of change of the number of subscribers from 2012 to 2015? Round to the nearest whole number, if necessary.
A researcher collected data on the number of daily posts on a blog. The results are shown in the scatterplot. The graphed regression function has an r
2
value of 0.89.
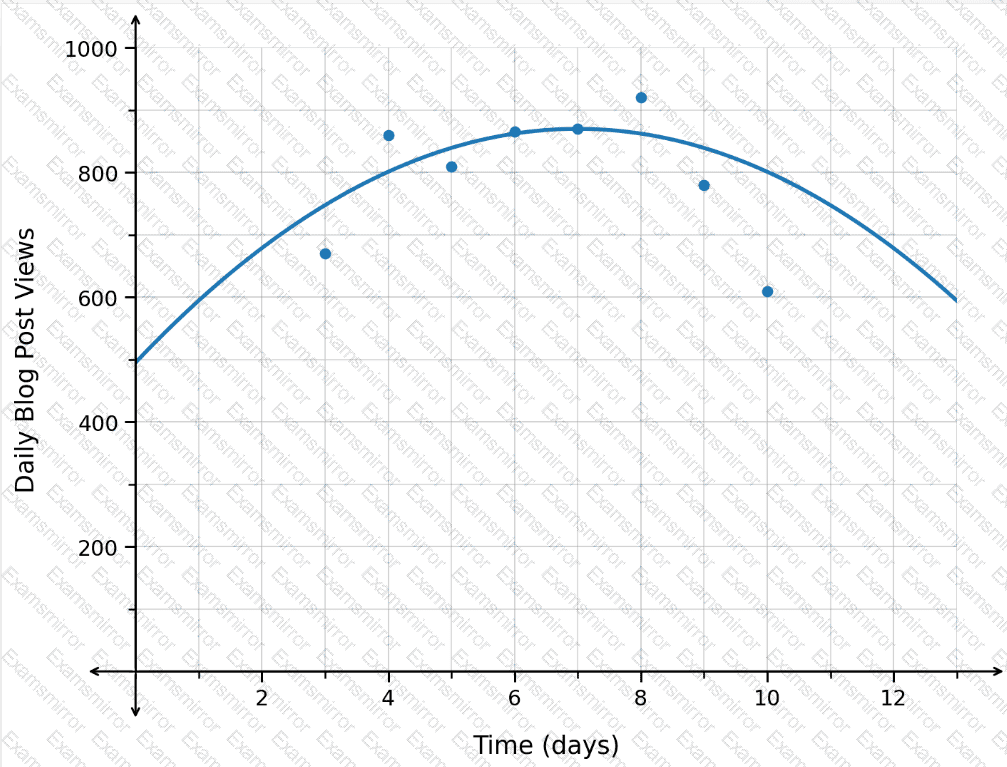
Is it appropriate to make a prediction for the number of daily posts after 18.6 months?
The graph shows the daily practice duration for a musician, where the number of days since the beginning of the month is along the horizontal axis and the number of minutes practiced per day is along the vertical axis.
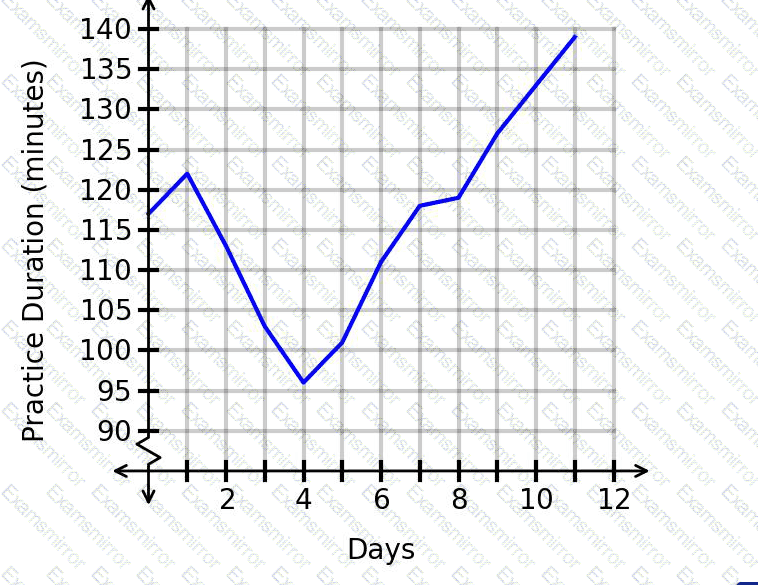
What was the practice duration for day 9, based on the graph?
The value of a collectible artifact is represented by the function
f(x)=330× 〖 1.15 〗 ^x
In this function, xrepresents the number of years since 2005, and f(x)represents the value of the artifact, in dollars.
Which value represents the average yearly rate of change of the value of the artifact from 2006 to 2011?
The logistic function f(x), whose graph is shown, models the number of people with a viral infection, where x represents the number of days since the outbreak of the virus and f(x) represents the number of viral infections.
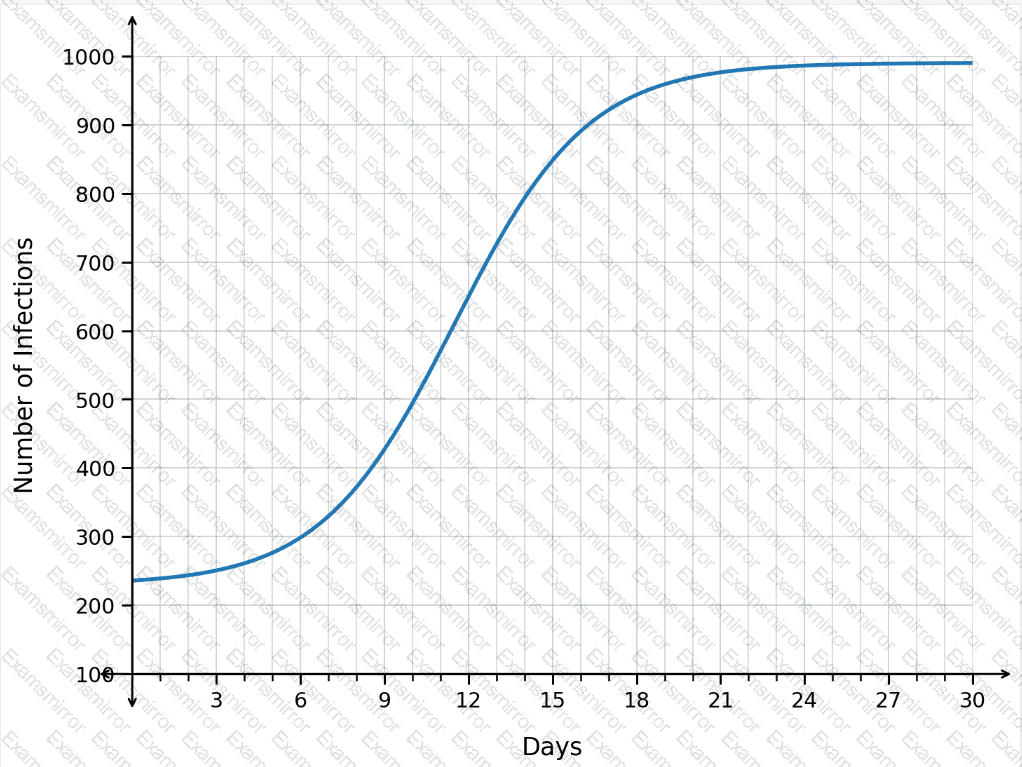
What happens as time progresses from day 9 to day 12?
Which statement correctly interprets u(8), given that u(t)=0.21t
3
−4.09t
2
+18.89t+69.5 represents the number of units, u, in an inventory warehouse t hours after 9:00 a.m.?

TOP CODES
Top selling exam codes in the certification world, popular, in demand and updated to help you pass on the first try.