
Summer Certification Limited Time 70% Discount Offer - Ends in 0d 00h 00m 00s - Coupon code = getmirror

Pass the WGU Courses and Certificates Applied-Algebra Questions and answers with ExamsMirror

Practice at least 50% of the questions to maximize your chances of passing.
Exam Applied-Algebra Premium Access

View all detail and faqs for the Applied-Algebra exam


321 Students Passed

87% Average Score

92% Same Questions
Viewing page 5 out of 5 pages
Viewing questions 41-50 out of questions
Questions # 41:

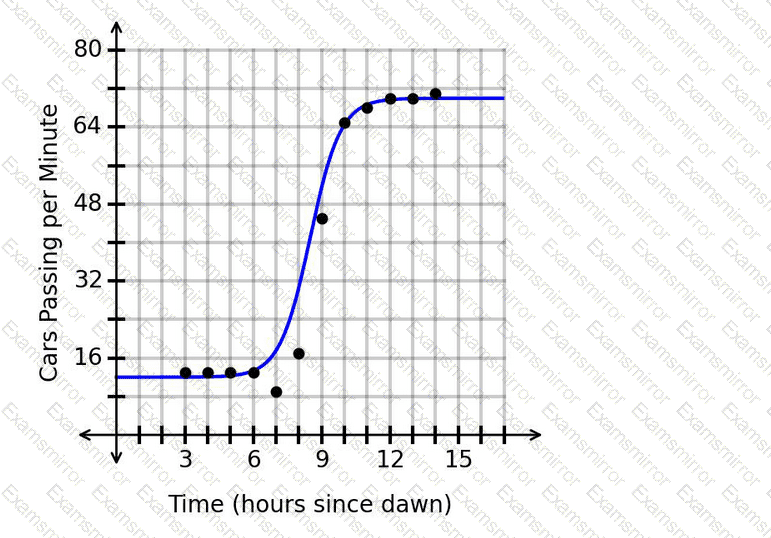
A researcher collected data on the traffic frequency on a section of road. The results are shown in the scatterplot. A regression function is graphed with r^2=0.96. The predicted traffic frequency 16.2 hours after dawn is 70 cars per minute.
Question # 41

Is this prediction appropriate?

Options:

A.

Yes. The r^2value indicates a moderate fit, and x=16.2is within 25%of the range of the maximum value.

B.

No. The r^2value indicates a strong fit, but x=16.2is more than 50%of the range beyond the maximum value.

C.

Yes. The r^2value indicates a strong fit, and x=16.2is within 50%of the range of the maximum value.

D.

No. The r^2value indicates a moderate fit, but x=16.2is more than 25%of the range beyond the maximum value.

Questions # 42:

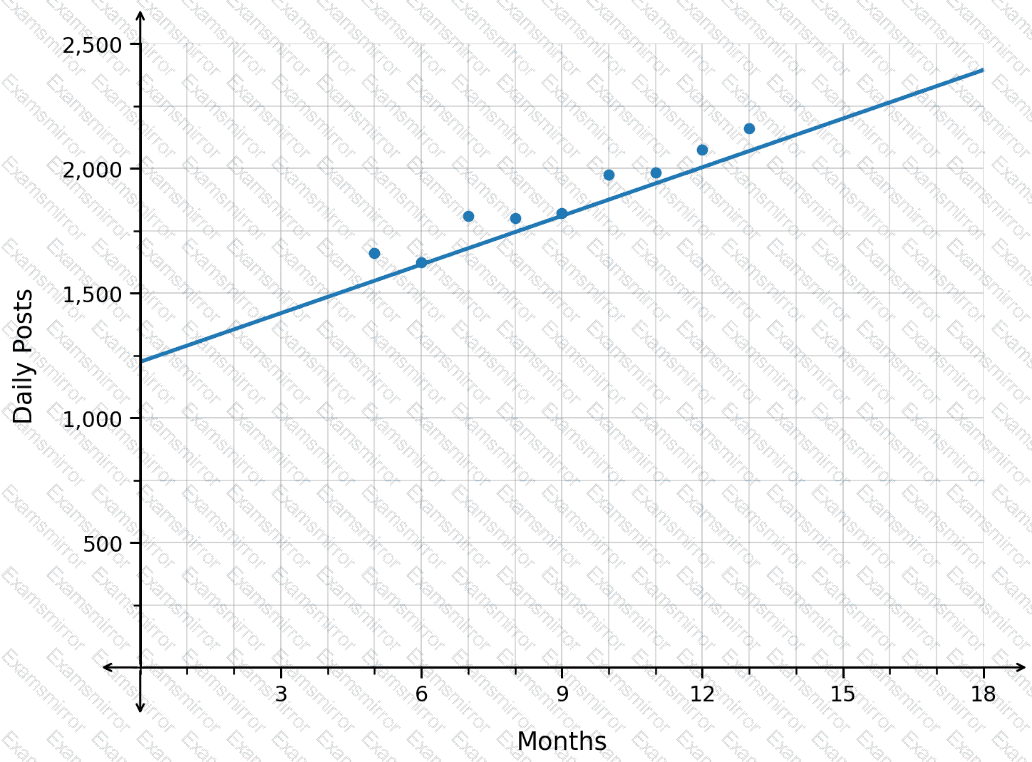
A researcher collected data on the average selling price for tickets to a concert over time. The results are shown in the scatterplot. A regression function is graphed with r

2

=0.56. The predicted average selling price for tickets after 10.8 days is $167.20.
Question # 42

Is this prediction appropriate?

Options:

A.

Yes. The r

2

value indicates a strong fit, and x=10.8 is within 50% of the range of the maximum value.

B.

Yes. The r

2

value indicates a moderate fit, and x=10.8 is within 25% of the range of the maximum value.

C.

No. The r

2

value indicates a strong fit, but x=10.8 is more than 50% of the range beyond the maximum value.

D.

No. The r

2

value indicates a moderate fit, but x=10.8 is more than 25% of the range beyond the maximum value.

Questions # 43:

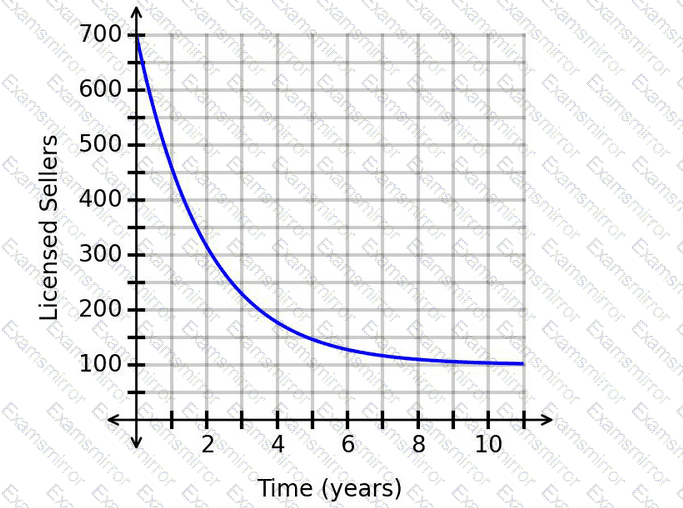
As regulations change, the number of licensed sellers of a product decreases. The graph models the change in the number of licensed sellers over time.
Question # 43

What does the horizontal asymptote mean?

Options:

A.

Over time, the number of licensed sellers will increase back up to 700.

B.

The number of licensed sellers was initially 700.

C.

In the long run, the number of licensed sellers nears 100.

D.

After 11 months, the number of licensed sellers decreased to 100.

Questions # 44:

The population of fish in a lake is changing according to the function

P(t)=24t+185

where tis the number of months since the beginning of the year and P(t)is the fish population at time t.

Which interpretation of the rate of change is correct?

Options:

A.

The number of fish in the lake is decreasing at a constant rate of 24 fish per month.

B.

The number of fish in the lake is increasing at a constant rate of 24 fish per month.

C.

The number of fish in the lake is increasing at a constant rate of 185 fish per month.

D.

The number of fish in the lake is decreasing at a constant rate of 185 fish per month.

Questions # 45:

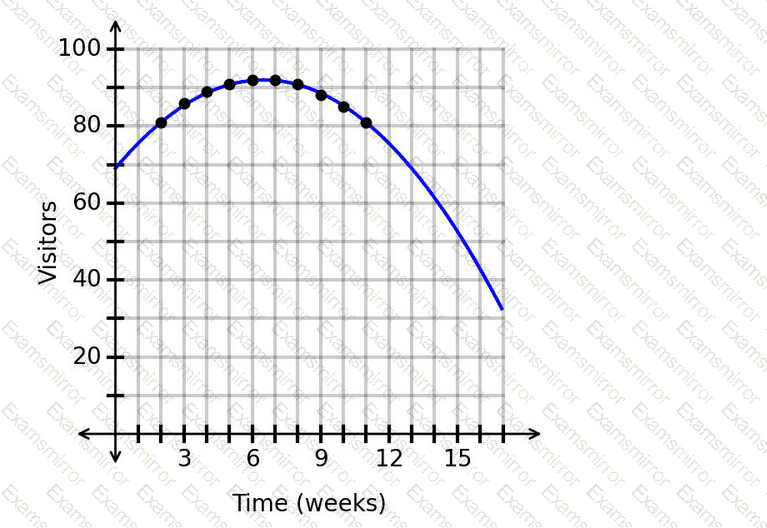
The scatterplot shows data on the number of visitors to a resort each week since opening. A regression function is graphed with r^2=0.99. The predicted number of visitors after 16.4weeks is 38.6.
Question # 45

Is this prediction appropriate?

Options:

A.

No. The r^2value indicates a strong fit, but x=16.4is more than 50%of the range beyond the maximum value.

B.

No. The r^2value indicates a moderate fit, but x=16.4is more than 25%of the range beyond the maximum value.

C.

Yes. The r^2value indicates a strong fit, and x=16.4is within 50%of the range of the maximum value.

D.

Yes. The r^2value indicates a moderate fit, and x=16.4is within 25%of the range of the maximum value.

Questions # 46:

The number of property sales in a region this year is expected to be 8 times the number of property sales in the region last year. The function H(x)represents the number of property sales this year, where xrepresents the number of properties sold last year.

Which notation represents the number of property sales this year, given that the number of properties sold last year was 360?

Options:

A.

H(2,880)=360

B.

H(45)=360

C.

H(360)=2,880

D.

H(360)=45

Questions # 47:

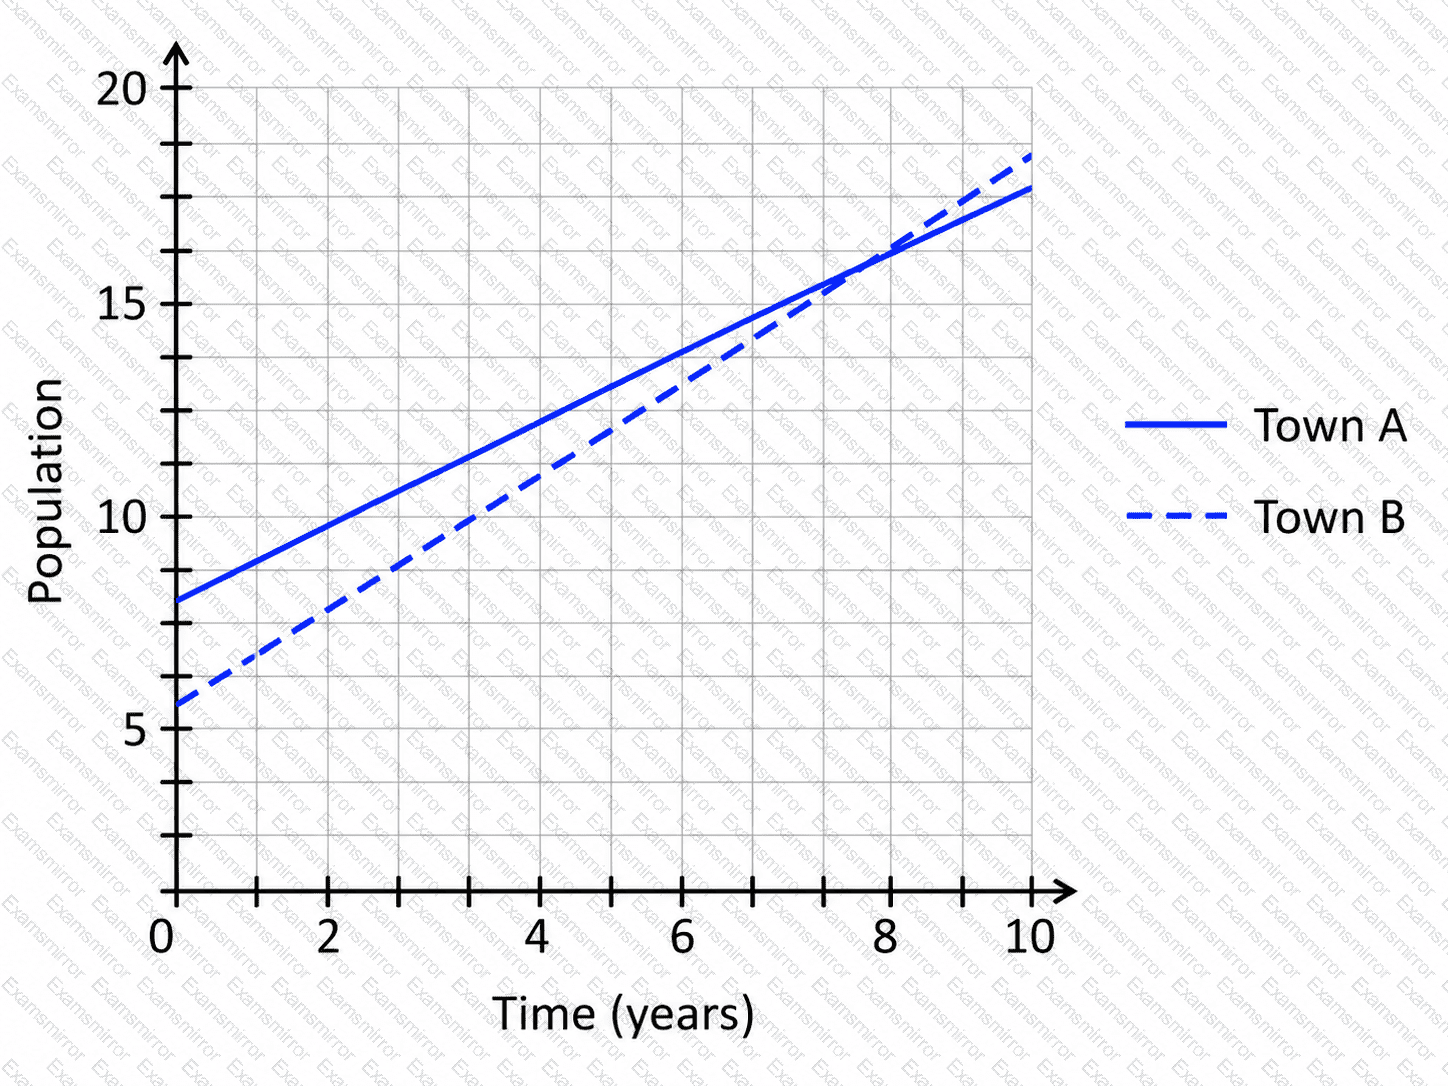
The populations, in thousands, of two towns are shown in the graph, where the horizontal axis measures the time in years.
Question # 47

Which town’s population is growing at a faster rate?

Options:

A.

Town A, because 8.0 > 5.5

B.

Town B, because 8.0 > 5.5

C.

Town A, because 1.3 > 1.0

D.

Town B, because 1.3 > 1.0

Questions # 48:

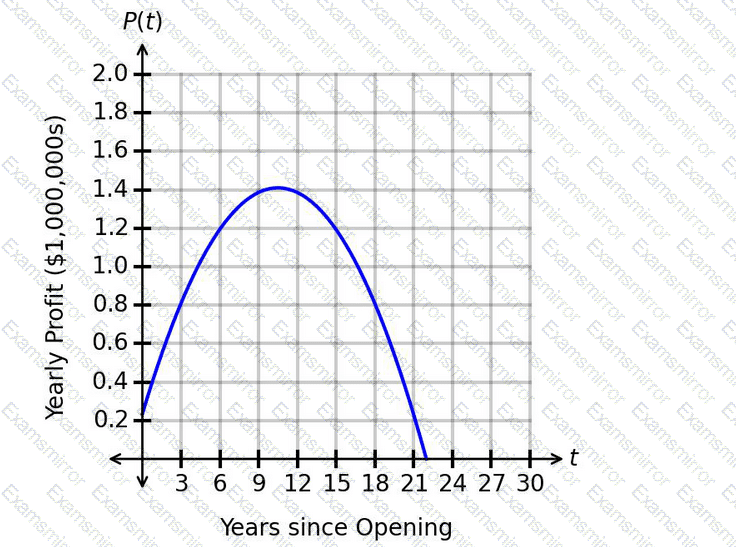
The function P(t)represents the yearly profit, in millions of dollars, for a streaming service since opening. The graph of P(t)is shown.
Question # 48

What is the correct interpretation of the maximum value?

Options:

A.

Approximately 10.5 years after opening, a maximum yearly profit of approximately $235,000was earned.

B.

Approximately 22 years after opening, a maximum yearly profit of approximately $235,000was earned.

C.

Approximately 10.5 years after opening, a maximum yearly profit of approximately $1,410,000was earned.

D.

Approximately 22 years after opening, a maximum yearly profit of approximately $1,410,000was earned.

Questions # 49:

The exponential function

f(x)=280× 〖 1.08 〗 ^x

represents the number of subscribers to a blog, where xrepresents the number of years since 2003 and f(x)represents the number of subscribers.

Which statement correctly interprets the average rate of change of the number of subscribers from 2003 to 2007? Round to the nearest whole number, if necessary.

Options:

A.

The number of subscribers decreases at an average rate of 330 subscribers per year.

B.

The number of subscribers decreases at an average rate of 25 subscribers per year.

C.

The number of subscribers increases at an average rate of 25 subscribers per year.

D.

The number of subscribers increases at an average rate of 330 subscribers per year.

Questions # 50:

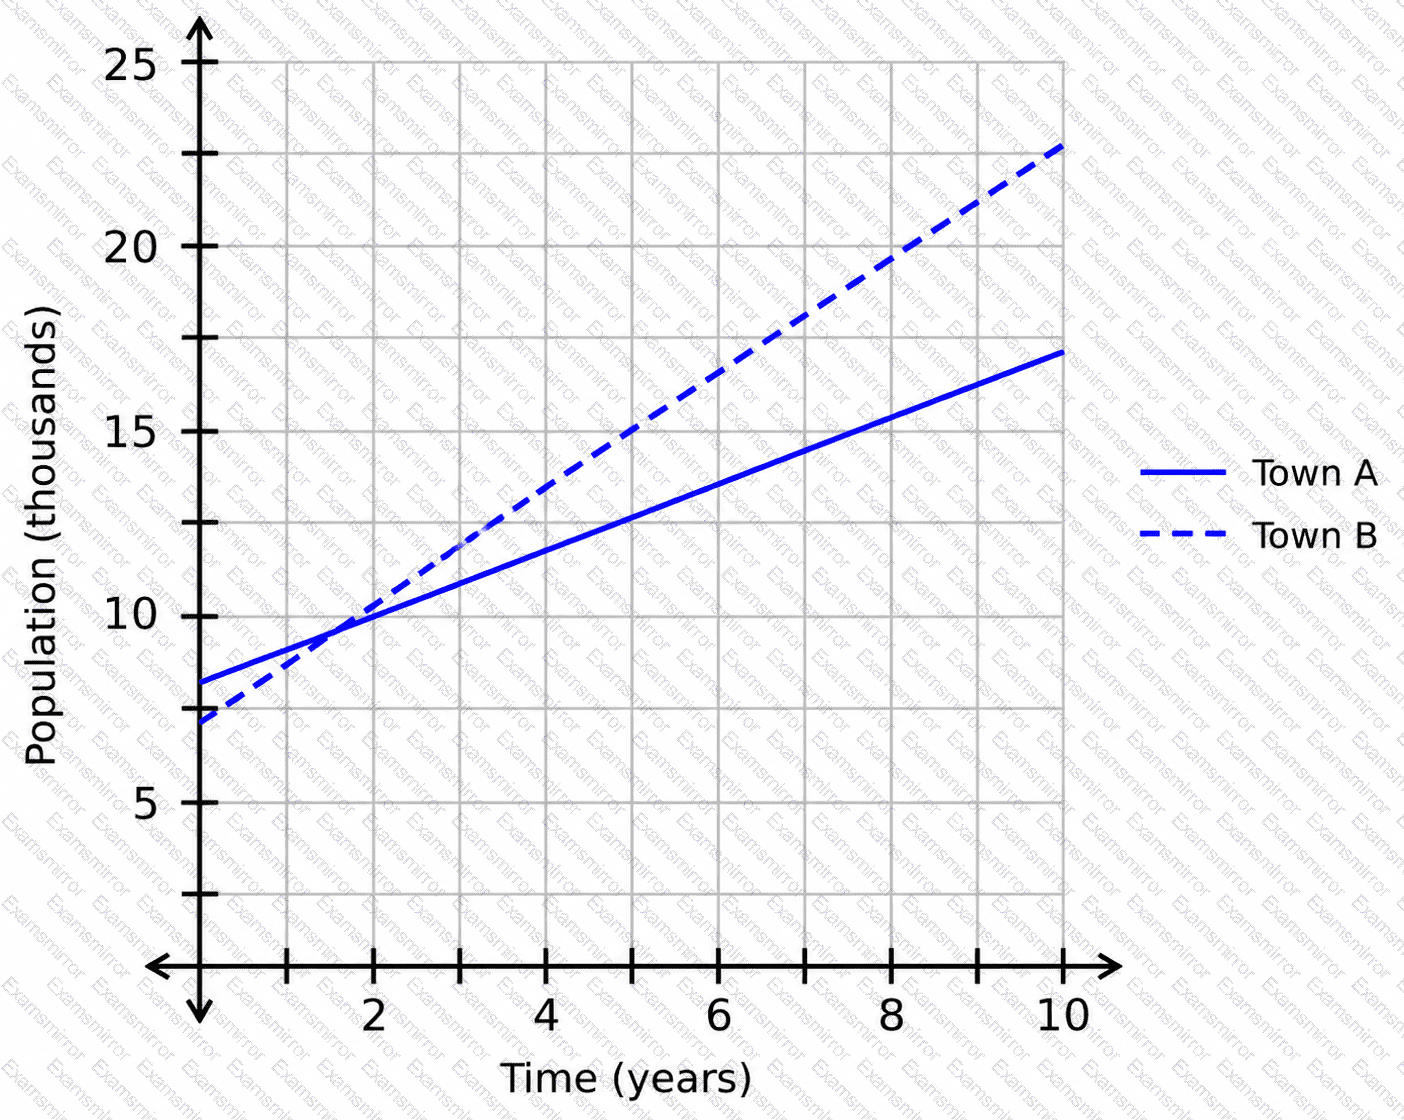
The populations, in thousands, of two towns are shown in the graph, where the horizontal axis measures the time in years.
Question # 50

Which town’s population is growing at a faster rate?

Options:

A.

Town B, because 1.6 > 0.9

B.

Town A, because 8.0 > 6.5

C.

Town B, because 8.0 > 6.5

D.

Town A, because 1.6 > 0.9

Viewing page 5 out of 5 pages
Viewing questions 41-50 out of questions
TOP CODES

TOP CODES

Top selling exam codes in the certification world, popular, in demand and updated to help you pass on the first try.